|
|
|
||

| |||
|
PyKE Primer - 7. Walk-through Examples A. EXTRACT AND COTREND NEW LIGHT CURVES FROM TARGET PIXEL FILES |
|||
|
Step 1: Plot archived SAP data The likelihood of source confusion around any given target is high. One cannot be certain whether astrophysical variability across a Kepler light curve comes entirely from the target star. In order to resolve the sources of variability within a target mask, the archive user should examine the TPF. For the purposes of this example, the archived SAP light curve of KIC 2449074 (kplr002449074-2009350155506_llc.fits) is shown in Figure A1, as rendered by kepdraw. Set the parameters to those shown in Figure A1 below. The infile field contains kplr002449074-2009350155506_llc.fits. When the parameters are set, press 'Execute'. 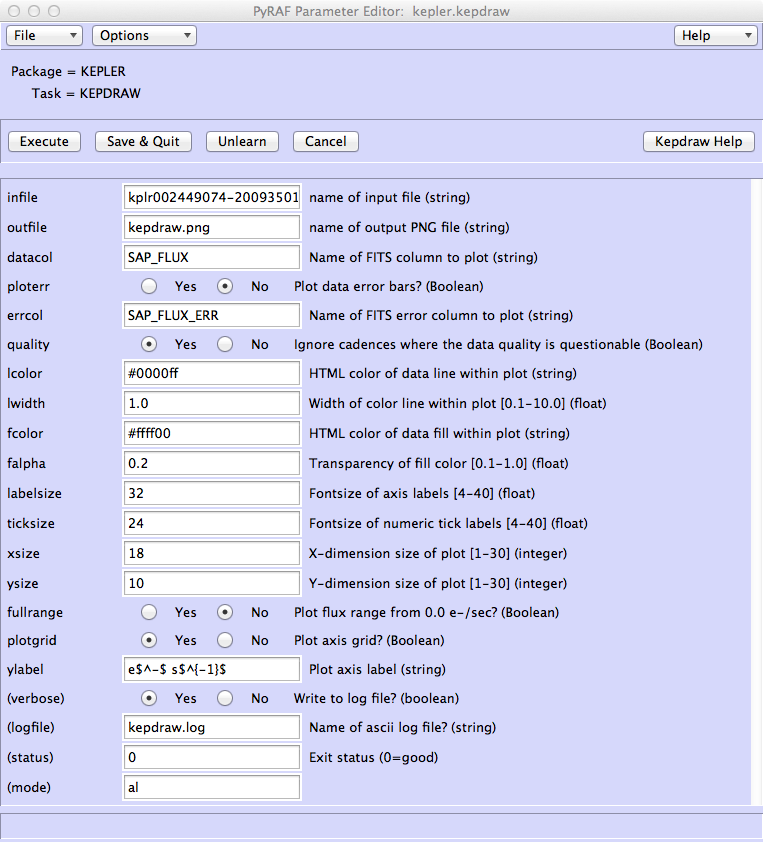

Figure A1: The archived quarter 3 SAP light curve of KIC 2449074. The regular dips in brightness every 4.9 d resemble a planetary transit. The delivered command is asking that the SAP_FLUX column in the archived FITS file kplr002449074-2009350155506 llc.fits be plotted to a new file called kepdraw.png. Plotting of the 1-σ error bars from the SAP_FLUX_ERR column is suppressed, and timestamps with non-zero quality flags will be ignored. Additional parameters control the look and feel of the plot – e.g. colors, line widths, fonts, etc. You will find icons along the bottom left of the plotting window that allow you to adjust the plot manually and re-save it. Systematic structure is apparent within the time series in the form of DVA and thermal trends following monthly data downloads. Step 2: Plot archived PDCSAP data In figure A2, we render the same data after systematic artifact mitigation by the Kepler pipeline's PDC module. The only parameter changed from before is that we now plot the PDCSAP_FLUX data column. The cotrending basis vectors have been fit and subtracted by the PDC module to largely remove systematic structure within the light curve. 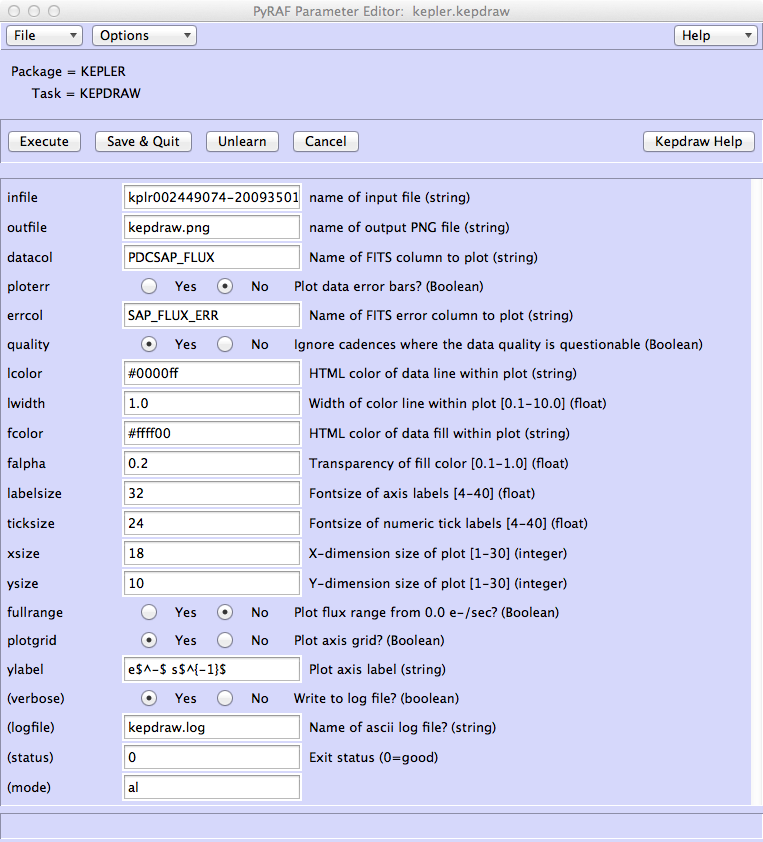
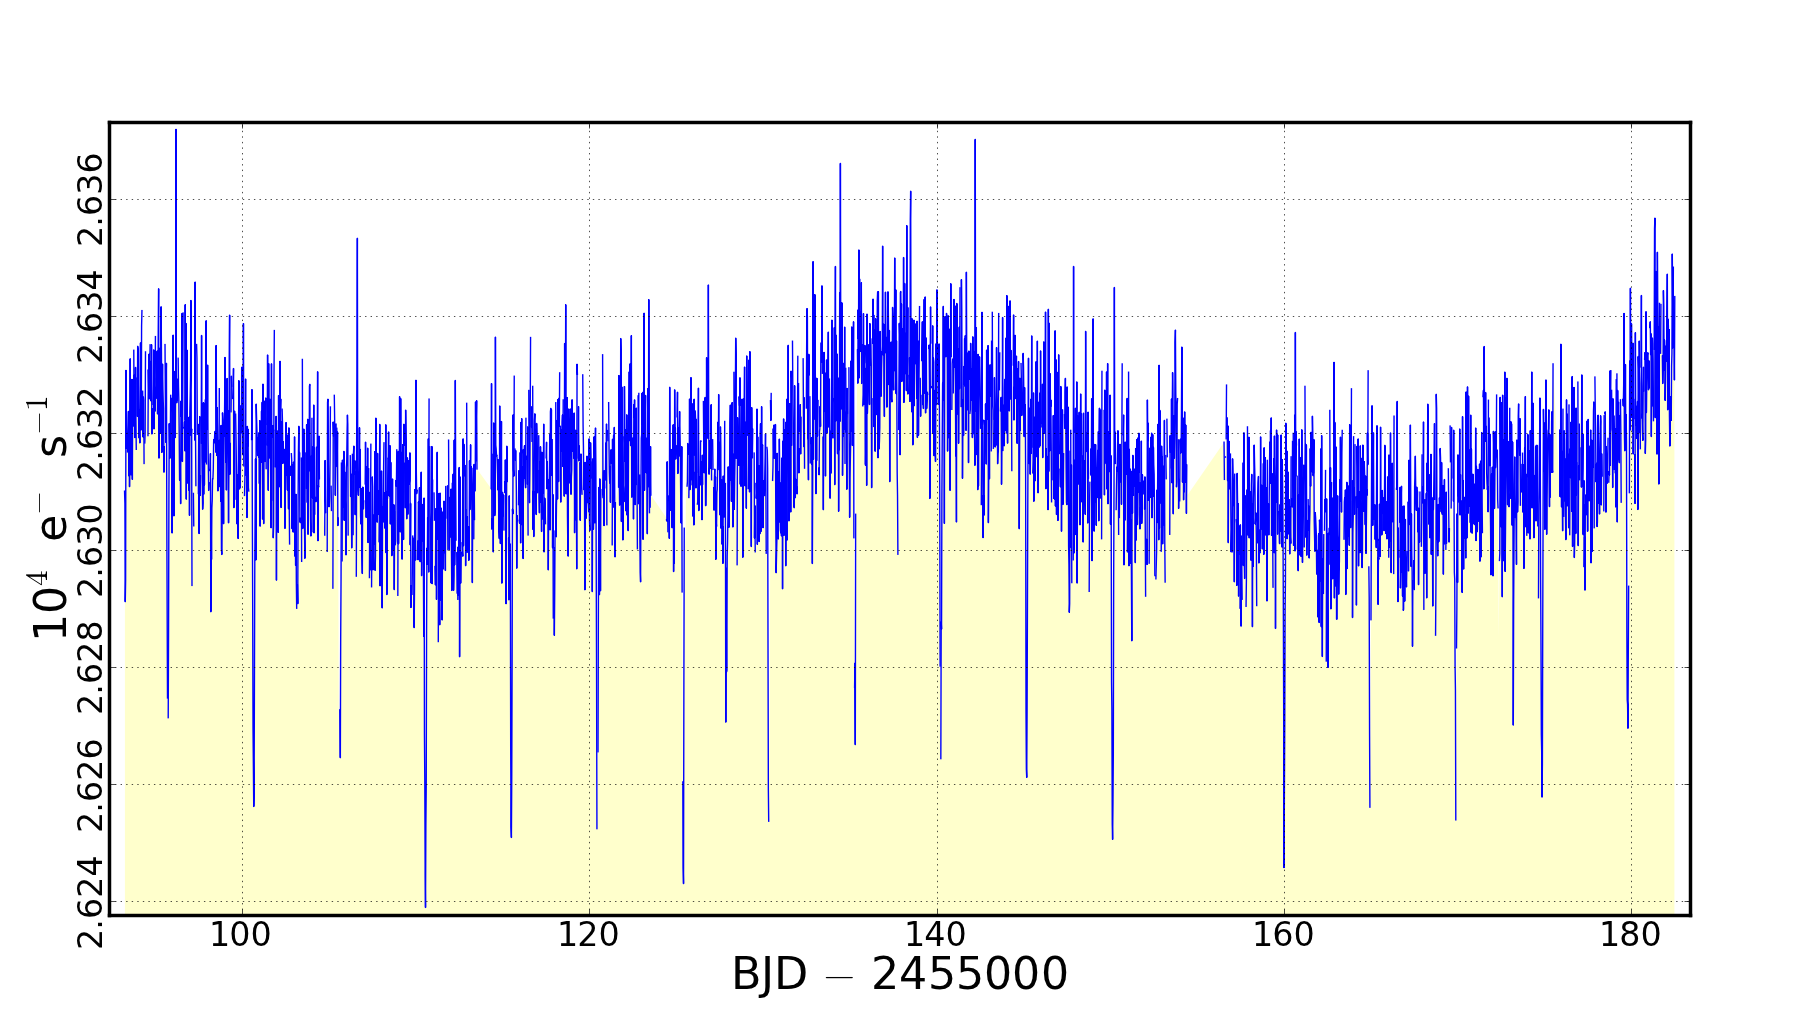
Figure A2: The archived quarter 3 PDCSAP light curve of KIC 2449074. This object shows regular, low amplitude dips in brightness every 4.9 days that, at face value, are suggestive of a planetary transit of the target star. Step 3: Plot archived photometric time-series for individual target pixels Figure A3 shows a calibrated flux time series of each target mask pixel collected over Q3. This figure was produced with the PyKE task keppixseries operating upon the TPF kplr002449074-2009350155506_lpd-targ.fits. The figure reveals unambiguously that the target star is not the source of the "transit" features. A background eclipsing binary star is situated 10 arcsec from the target star (2.5 pixels to the left of KIC 2449074 on the figure) and is leaking into the optimal aperture. 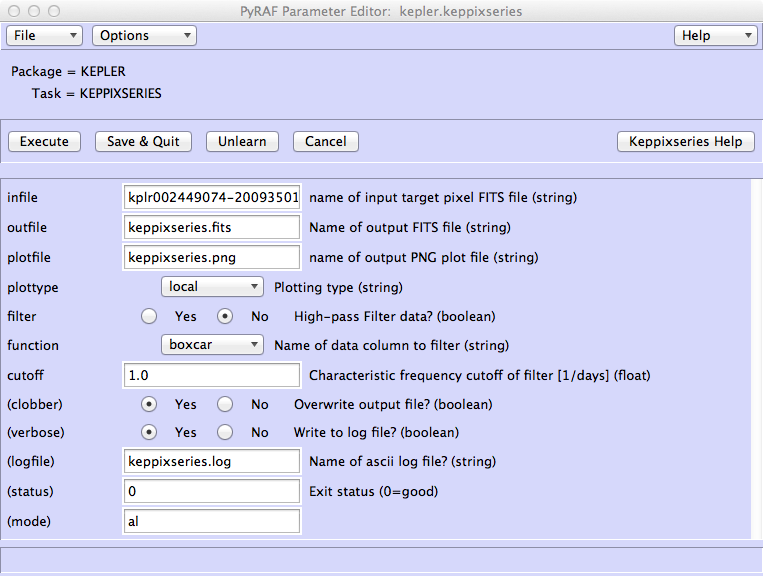
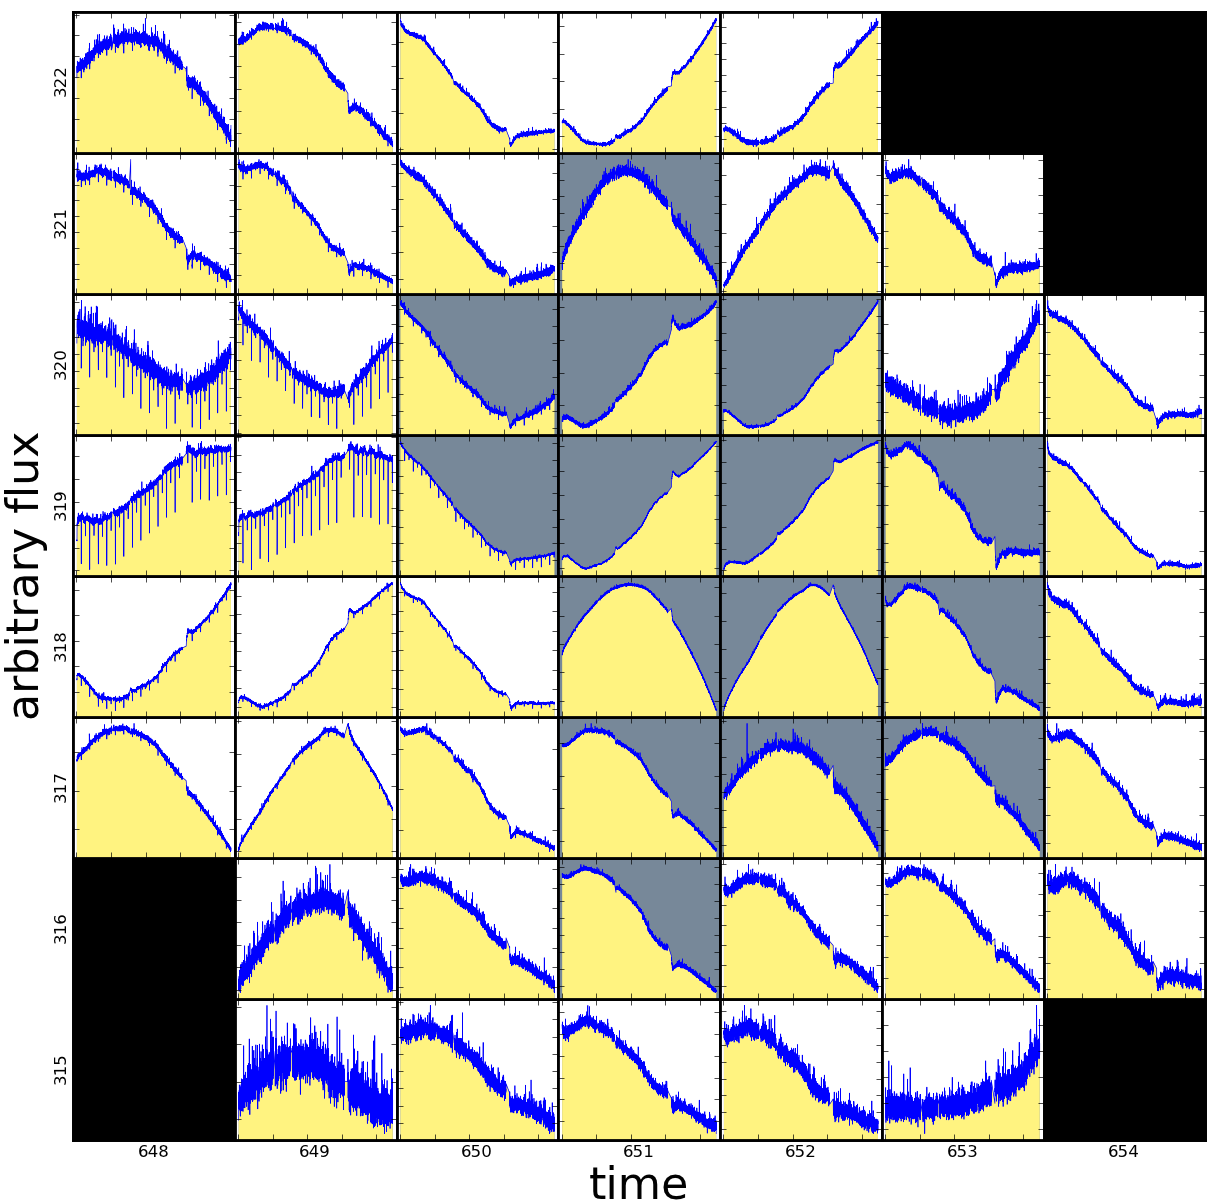
Figure A3: Calibrated time-series photometry for every pixel within the mask surrounding the quarter 3 target KIC 2449074. Each light curve is plotted on an independent flux scale. Source confusion with a background binary within the optimal aperture (gray pixels) is evident, most notably in pixel [650,319] The source of the regular dips found in the PDCSAP light curve of Figure A2 is not the target that the mask was designed for. The source of the dips is a faint, background binary star on the left-hand side of the mask. Step 4: Define new optimal apertures for target and background binary star By extracting the light curve manually using different pixels, we can either reduce the contaminating flux from the eclipsing binary in the target light curve or, alternatively, extract a separate light curve from the eclipsing binary. New mask files are created interactively from the TPF kplr002449074-2009350155506_lpd-targ.fits using the kepmask tool. maskfile is the primary output from the tool - an ASCII file defining a new pixel mask in terms of the rows and columns of the detector. Figure A4 plots the mask stored in the file mask1.txt, while Figure A5 plots the mask stored in file mask2.txt. The image associated with the 2,177th timestamp in the Target Pixel File is plotted on a linear intensity scale using the bone color lookup table. The new aperture is stored for future use within files called mask1.txt and mask2.txt. Users of the kepmask tool define a new aperture interactively by moving their mouse over a pixel. One press of the ’X’ keyboard key selects a pixel for inclusion within the new aperture, a second press deselects the pixel. The aperture is written to file by clicking the ’DUMP’ button on the interactive GUI. 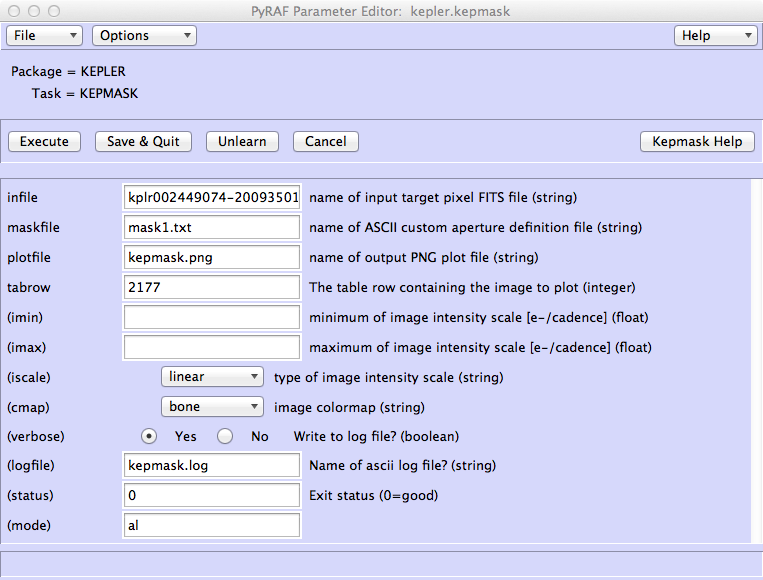
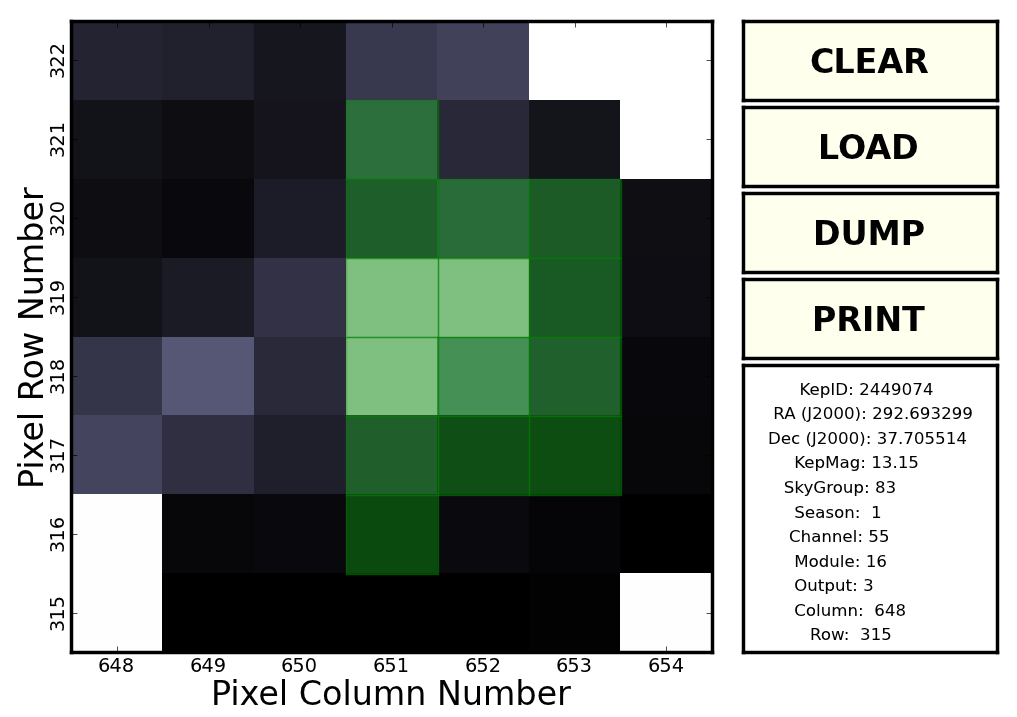
Figure A4: This pixel map image is a typical flux image within the quarter 3 pixel mask of KIC 2449074. The green region is a user-defined photometric aperture that maximizes the signal from the target star. The new selection of pixels, as indicated in green, minimizes the contamination from a background eclipsing binary. When summed, the pixels within the new optimal aperture produce the upper light curve in Figure A6. 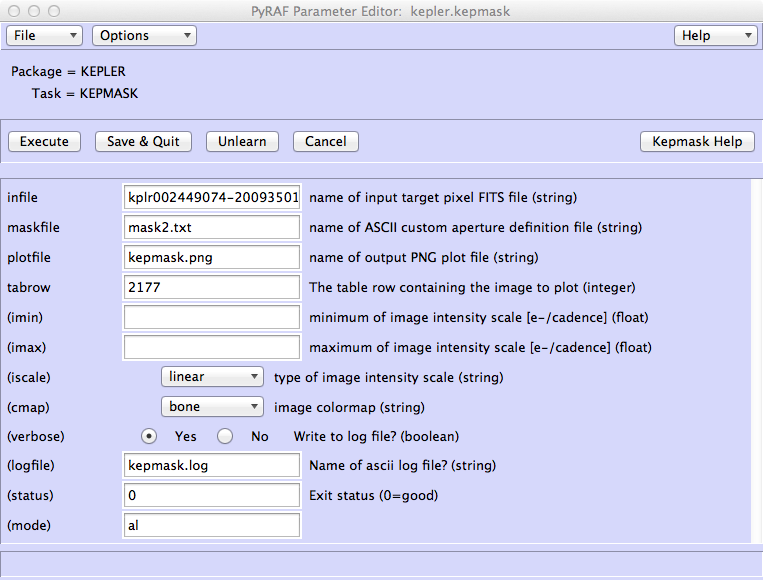

Figure A5: As for Figure A4, except the green region is a manually-defined optimal aperture that maximizes the signal from a background binary star. The selected green pixels minimize the contamination from the target star. When summed, the pixels within the new optimal aperture produce the upper light curve in Figure A7. Step 5: Extract new SAP light curves from the TPF The PyKE tool kepextract can be called to extract new SAP light curves from the TPF. We can create two new light curves using the following invocations: 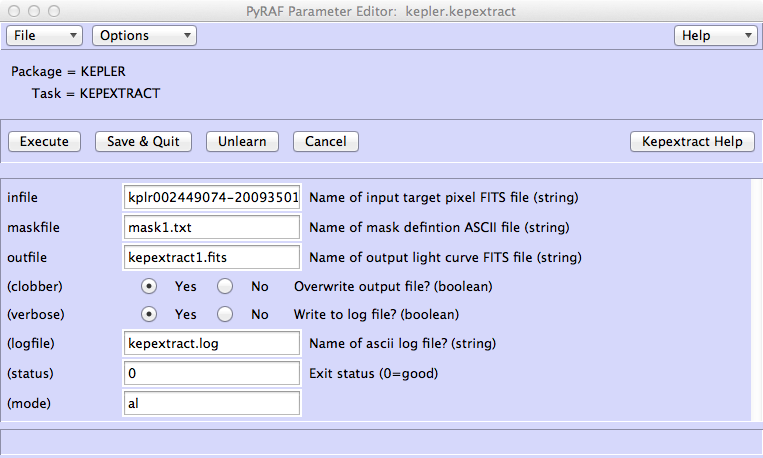
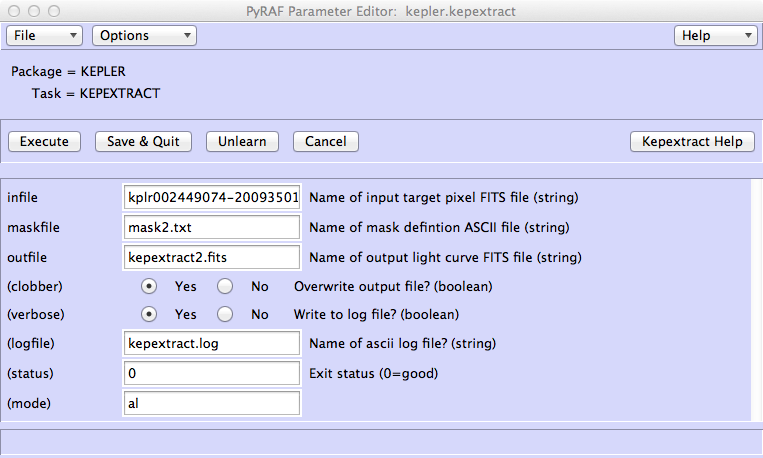
Step 6: Mitigate for systematic artifacts in new SAP light curves The extracted light curves are constructed by simple pixel summation. Consequently artifacts resulting from target motion across the pixel aperture exist within the new light curves. Artifacts can be reduced or removed by fitting and subtracting the best fit ensemble of Cotrending Basis Vectors (CBVs). Users must ensure that they download CBVs from the MAST correctly corresponding to the quarter being analyzed. In the current case, the Q3 CBV is called kplr2009350155506-q03-d14_lcbv.fits. Artifact correction is performed by the kepcotrend tool. The corrected light curve is stored in an output file within a new FITS column called CBVSAP_FLUX. 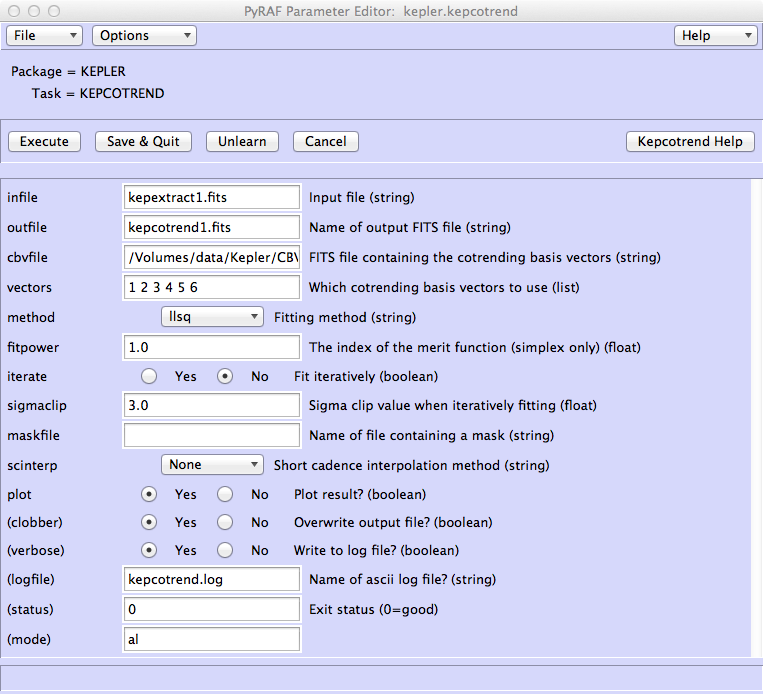
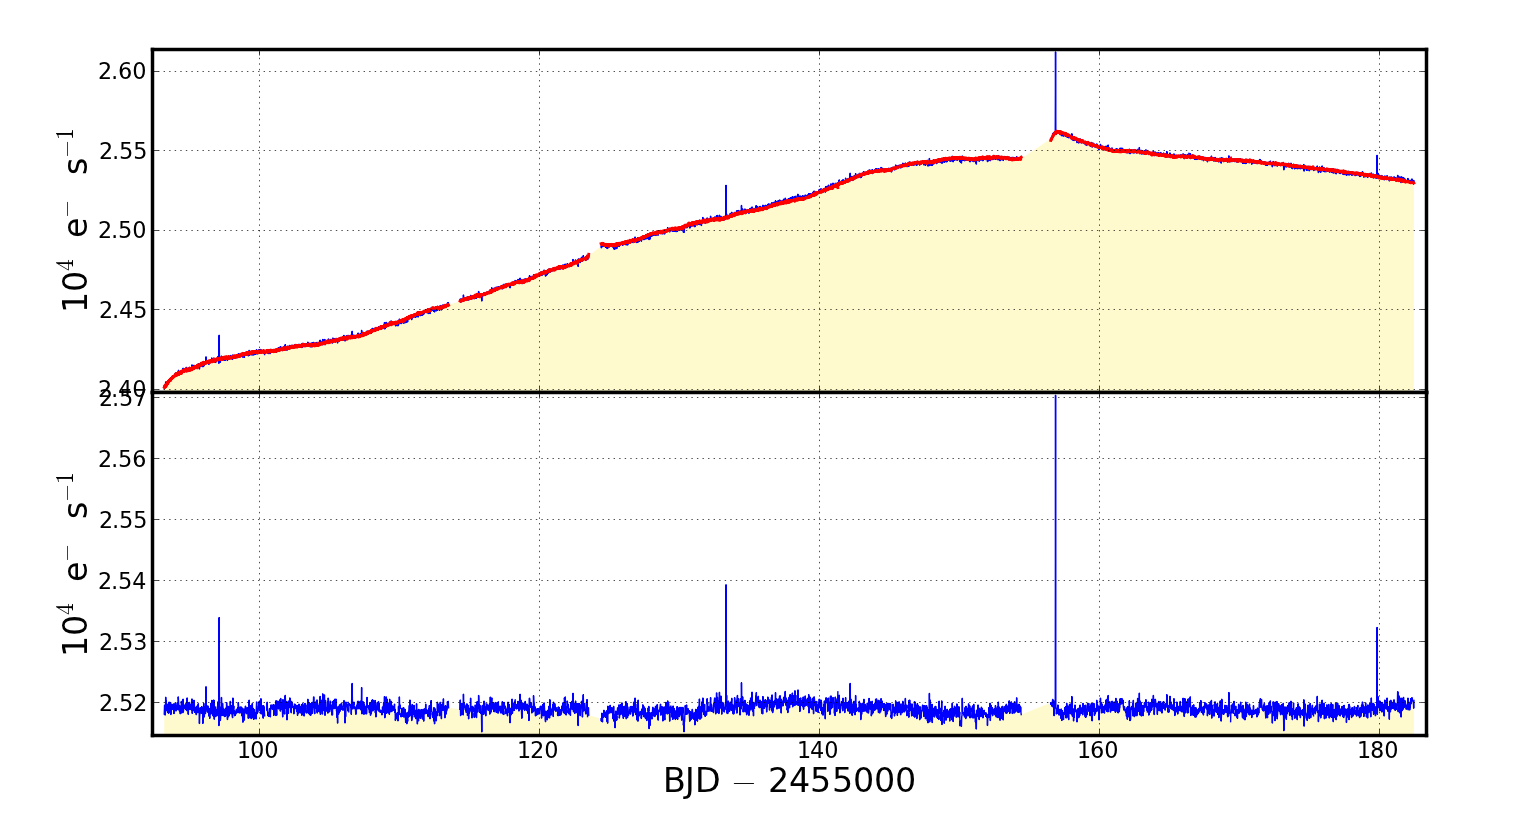
Figure A6: Systematic artifact removal from a less contaminated light curve of the Kepler survey target KIC2 449074, using the kepcotrend task. The six most significant CBVs were fit to and subtracted from the SAP light curve contained in the file kepextract1.fits. Top - The blue curve is the SAP light curve derived from the pixel aperture defined in Figure A4. The red curve is the best fit CBV ensemble. Bottom - Corrected light curve after the subtraction of best-fit CBV ensemble. 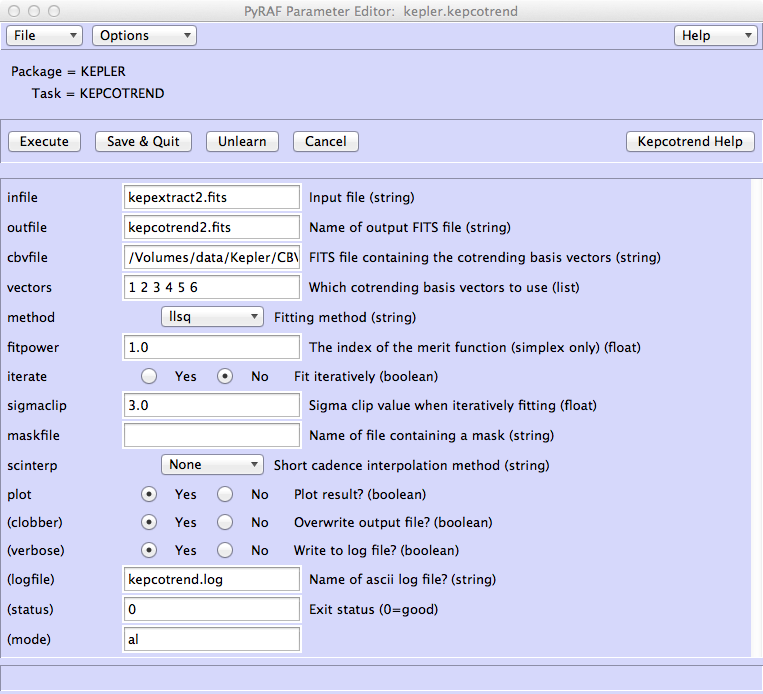
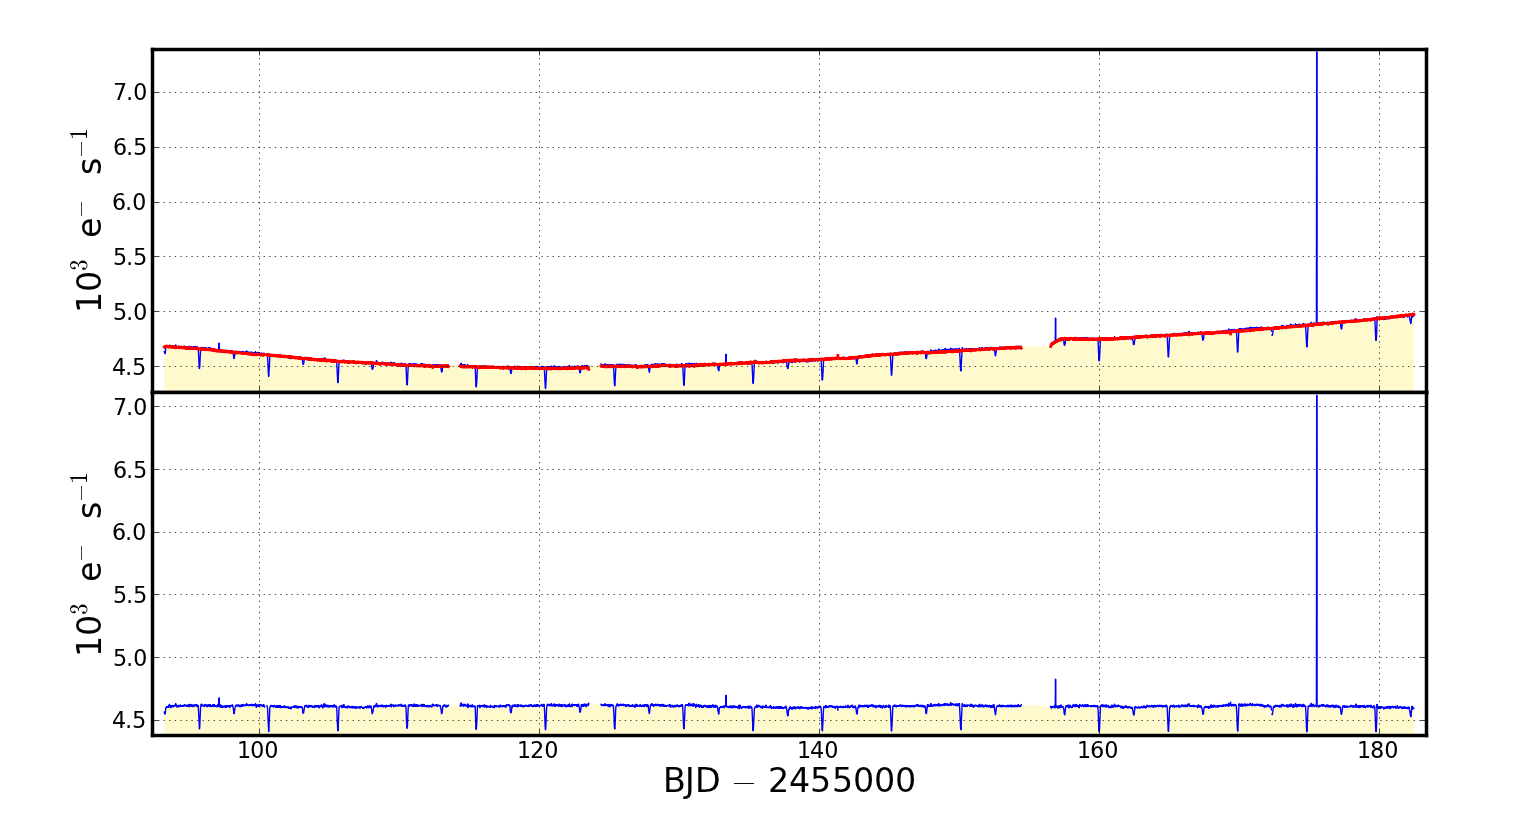
Figure A7: Systematic artifact removal from a light curve extracted around a nearby background binary star confused with the Kepler survey target KIC2 449074, using the kepcotrend task. The six most significant CBVs were fit to and subtracted from the SAP light curve contained in the file kepextract2.fits. Top - The blue curve is the SAP light curve derived from the pixel aperture defined in Figure A5. The red curve is the best fit CBV ensemble. Bottom - Corrected light curve after the subtraction of best-fit CBV ensemble. |
Up: PyKE Walk-through Examples
Questions concerning Kepler's science opportunities and open programs, public archive or community tools? Contact us via the email address.