|
PRE-SEARCH DATA CONDITIONING (PDC)
OVERVIEW
The PDC software module examines the calibrated light
curve produced by PA, and applies a series of corrections, based on both known instrumental
and spacecraft anamolies, and unanticipated artifacts found in the data. "Pre-search" refers
to data conditioning prior to executing a transit search, which is undertaken by the
next module in the pipeline, TPS.
The primary tasks of PDC are: (A) Correct systematic errors,
(B) Remove excess flux in source apertures due to contamination from nearby stars, (C)
Identify outlying data points. PDC was designed to remove systematic errors
that are correlated with known spacecraft anomalies, ancillary engineering data,or pipeline
generated data, such as the centroid motion time series. Its fundamental purpose is to condition
long cadence light curves for the following transiting planet search, executed in the TPS module.
The goals of conditioning light curves for optimal transit analysis, and robust detection of
other time-variable astrophysical phenomena which may be present, are not in principle or in
practice mutually realizable. Significant programming efforts have been made to preserve
natural variability of sources in the PDC software. The Kepler project continues an active
program of testing and modifying the software to both validate and improve the realiability
of transits and intrinsic variabilty detection. For a large range of variable sources, the
output of PDC appears well aligned with the output of PA, the quality of the light curves are
improved after correction for systematic errors, and the instrinsic variabilty preserved.
Users should exercise caution if their phenomena of interest are much shorter (<1 h) or much longer
(>5 d) than transit timescales, or display complex light curves with timescales similar to those
expected for Earth-like transits (1-10 hrs), e.g., eclipsing binaries.
Users should always compare the light curves produce by PA and PDC, and be cognizant of the
differences. Please examine the relevant release notes, as well as additional commentary on
these pages.
DOCUMENTATION
The purpose of this webpage is to provide a guide to PDC
functionality, and describe our understanding of the accuracy of its output. GOs and archival
users are urged to review the primary documentation, and look here for updates and discussion of
specific issues. Primary documentation includes:
- Kepler Instrument
Handbook, Version 1, 15-July-2010.
- Data Release Notes,
detailed information for each data release, either initial or reprocessed data per
quarter.
- Jenkins etal,
2010, "Overview of the Kepler Science Processing Pipeline".
- Jenkins etal,
2010, "Initial Characteristics of Kepler Long Cadence Data for Detecting Transiting
Planets".
- "Presearch Data Conditioning in the Kepler Science Operations Center Pipeline", by
J. Twicken etal, SPIE Conference on Astronomical Instrumentation, June 2010
(paper available July 2010).
PDC FUNCTIONS
PDC is executed in single channel "chunks", in which
all sources located on a single channel (aka "mod.out") are processed through the
software. For 1-min observations (short cadence), the duration is one month; for 30-min
observations, an entire quarter is processed. In order PDC executes the following tasks.
-
Data anomaly flagging
At initiation, observations affected by known anomlies are flagged, to exclude their use
in systematic error corrections. Discrete discontinuities are introduced into the light
curves by known spacecraft activities such as the monthly Earth point downlinks, and
commanded attitude adjustments, and by unanticipated events, e.g., the occasional
safe mode. In addition to missing data, photometry may be present for some cadences but
in a degraded form due to planned activities such as the reaction wheel desaturations
(affects 1 cadence every 3 days), and unanticipated events,
e.g.., argabrightenings identified by PA, and loss of fine point. Effected cadences and
their corresponding data anomalies are tabulated in the
data release notes
specific to the dataset under study. Users must identify corrupted cadences using the
data release notes, as these data anomaly flags are not currently tabulated in the light
curve files released by MAST. The Project is currently working to expand and update the
content of the light curve tables, to include these data flags. We expect these upgrades
to be included in Release 7.0 of the pipeline software.
Resample ancillary spacecraft data
Engineering data is obtained on a variety of timescales. Before correlating these data to the
photometry, the ancillary data is rebinned to match the sampling rate (1 & 30 mins) of the
cadence data.
-
Identification and correction of discontinuities
In addition to known data gaps described above, source-specific flux discontinuities have
been observed since Q0. Many, but not all, random flux discontinuities are likely caused by
impacts of solar and galactic cosmic rays on the CCDs. Impulsive energy deposition from cosmic
rays alters the
photo-sensitivity of individual pixels, which may recover on a variety of timescales.
In this step, PDC identifies discontinuities in the light curves, and estimates the
flux offset. Discontinuities are corrected on a single or multiple cadence basis, using the
estimated offsets. An example is presented below.
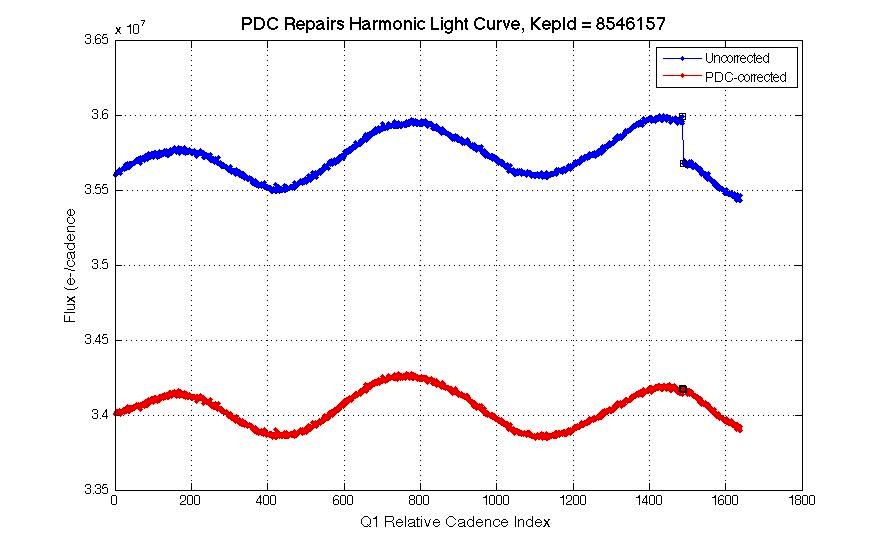
Example of PDC systematic error correction for a smoothly
varying star. This source was observed during Q1 and has Kp = 14.5. A flux discontinuity
specific to this star is observed at a cadence index of ~1450. PDC corrects this anomaly
by "stiching" the curves together. PDC output is coded red in the figure; this light
curve is tabulated as the "corrected" light curve in the files available from MAST.
(Adapted from DRN5).
-
Identify variable stars
PDC attempts to separate "quiet" stars from variable sources, using a tunable variability
filter. Values of 0.5 and 0.25 % center-to-peak variation has been used in different data
releases; check the relevant release notes for your data. This switch determines the following
detrending options; variable stars are treated differently than quiescent stars.
-
Identify astrophysical events
Astrophysical events must be identifed, as best as possible, to prevent those events
from affecting the correlation of the synchronized engineering data to the light curves.
These signatures, e.g., giant planet transits, stellar eclipses, flares and microlensing events,
are located in the calibrated light curves, and replaced temporarily with values interpolated
across relevant candences.
-
Systematic error correction for quiet stars
For sources below the variability threshold, the light curve is compared to the resampled
ancillary engineering data and centroid motion time series, to identify and remove correlated
trends. This process is termed contrending
in the Kepler documentation. A singular value decomposition approach is utilized, to identify
systematic trends at many frequencies in the data which appear to be induced by some
spacecraft or detector process. An example would be an observed flux variation correlated with
periodic focus changes induced by flexure in the optics. The goal of contrending is to
remove flux signatures that are correlated with the ancillary data on the specified time scales.
During the first year of operation, the project has found that the systematic errors are caused
primarily by target motion at the pixel or sub-pixel level, which modifies the collected signal.
Contrending against the centroid motion time series improves the quality and noise content of
the data. Another noise source is thermal transients observed following safe modes and the
monthly downlinks. The changing thermal environment of the spacecraft following these events
induces focus changes, which alters the source PSFs. These transients last a few days (1 day =
48 30-min observations), affecting a few hundred long cadence datapoints. Systematic error
correction is vital for the capability to identify transiting planet search, especially the small
signal (on order 100 PPM) expected from Earth-sized planets. Without these corrections, large
numbers (thousands) of possible transit detections would be triggered, severely impacting the
science. Users are cautioned to be aware that low amplitude periodic astrophysical signals
which are correlated with the ancillary data will likely be compromised. Comments on the
performance of PDC are provided below.
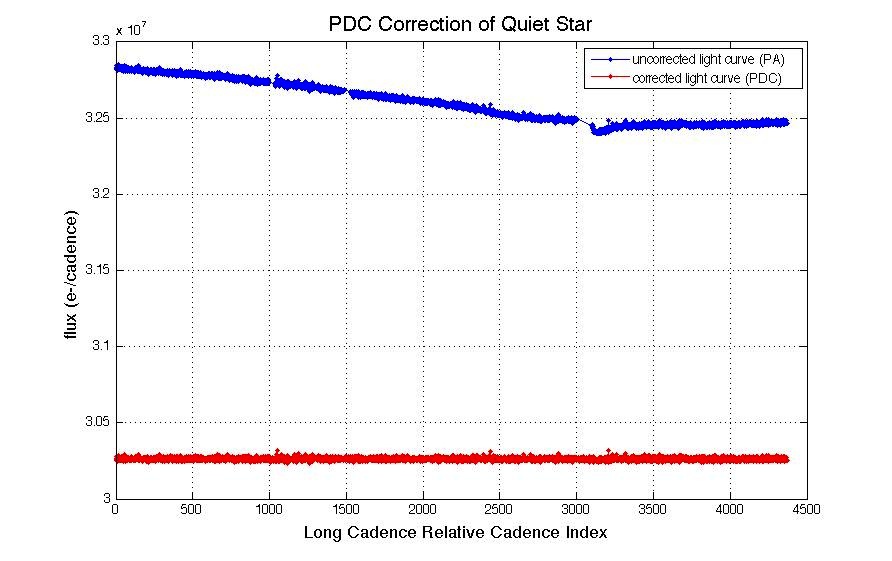
Example of PDC systematic error correction of a quiet star. This
source was observed during Q3 and has Kp = 14.6. The gap between cadence indices 3000 and 3100
was produced by a safe mode event followed by the monthly data download and subsequent thermal
transient. Here PDC corrected the light curve slope based on contrending with the centroid
motion solution, corrected the discontinuity due to the downlink, and corrected for focus
changes induced by the thermal transient produced by the downlink. (Adapted from DRN5).
-
Systematic error correction for variable stars
Systematic error correction is a challenge when intrinsic variability is present, as noted
above. For sources exceeding the variability threshold, PDC attempts to model periodic behavior,
in order to fit and remove this component and correlate against the underlying
light curve. Note that robust detection of variability can be comprised in the presence of large
discontinuities in the data; in these cases PDC may produce spurious results. On the other hand
smoothly varying stars are generally well-fit by PDC, preserving the astrophysical signal, and
reducing the noise level. For stars tagged as variable, the following steps are taken:
(a) Correct for thermal transients and differential velocity abberation
(b) Fit the periodic content. If successful, remove the fitted harmonic content
from the light curves.
(c) Apply the contrending procedure to the residual light curve
(d) Apply metrics to assess the results
(e) Choose the non-variable or variable cotrending result for each target initially
identified as variable.

Example of PDC systematic error correction for a variable
star without a strong periodic component. The star is variable on short time scales; over
Q3 two discontinuities are observed, along with a linear term produced by differential velocity
aberration. (Adapted from DRN5).
For some sources, the cotrending has been found to
produce unacceptable results. In these situations, the calibrated light curve (PA output)
is substituted for the cotrended light curve. For these targets, systematic effects
which are a component of the contrending algorithm are not addressed in PDC.
-
Correct excess flux
Some of the signal within the optimal aperture arises from the PSF wings of nearby sources,
contaminating the signal from the target. PDC subtracts an estimate of this excess flux,
based on a source-specific crowding metric, defined as the fraction of starlight
arising from the target star. This metric has a range of [0-1], where 1 implies all light
comes from the target, and 0 = all background. Simple aperture photometry produced by PA is
not corrected for source crowding. The crowding metric is derived from the distribution of
surrounding stars as tabulated in the KIC, and the measured structure of the pixel-response
functions of the source and nearby stars. Since each source is observed on a dfferent
location of the focal plane each quarte, a consequence of the quarterly roll; the PRFs,
optimal apertures, and crowding metric are defined each quarter.
Users will see an offset in flux level when plotting PA output versus PDC output. The
offset is a measure of the source contamination correction.
-
Identification of outlying data points
To aid in the transit search, PDC searches for data points lying outside (+/-) an adjustable
range. A median filter is applied after masking of potential astrophysical events, such as
giant planet transits, stellar flares, and microlensing. After removing the median, the
residual light curve is examined for points lying further than a pre-set value. In the subsequent
transit search phase, flagged points are filled ("gapped") via interpolation. However,
GO and archival users will see light curves in which outliers are NOT removed; the data is
unaltered for user interpretation.
PERFORMANCE and CAUTIONS
The Kepler data pipeline is optimized for transit searches,
especially for sensitivity to weak signals from Earth-sized planets. Note that the motivation
for fitting and removing periodic signals is to reduce systematic noise even in highly variable
stars, so that transits can be robustly detected against the background of source variability.
Kepler expected to and is finding many eclipsing binaries, in which the ampltiude of the stellar
periodic signal greatly exceeds any planet transit. Such systems are top priority candidates for
transit detection, since the orbital orientation of the stellar pair is known, and close to 90 degrees.
Significant effort is being expended to preserve source variability and maximize transit detections.
Some precautions for working with the conditioned data:
Kepler is more sensistive then any previous photometer
producing near-continuous time series. The mission is also exploring a variability domain
not previously accessible. Therefore, we are encountering subtleties in the data and the data
processing not seen before. Kepler is an ongoing experiment, in which the accuracy of the data
will improve with time, as understanding of the detectors, processing algorithms, and natural
variability increase.
Users are reminded to compare the calibrated light curve (PA) to the corrected light
curves (PDC), to ascertain the reliability of any astrophysical signature in your data.
PDC gives satisfactory results on most stars which are either
intrinsically quiet, or have well-defined harmonic light curves. It also performs well in
cases where the star is variable, but without a dominant harmonic term (see figure below).
Following are examples of specifc situations found in PDC output of which the user should be
aware:
(a) Fails to identify and correct a source-specific discontinuity.
(b) Poor detrending may introduce noise into complex lightcurves.
(c) May identify a stellar eclipse as a flux discontinuity.
(d) Fail to accurately track slowly rising or declining flux levels over a quarter.
If this linear term is correlated with centroid motion times series, the linear term may
be removed from the data.
(e) Positive outlyers which are real events, but not flagged as such. PDC may tag these
events as discontinuities, and attempt to correct.

Output of PA (top curve) and PDC (bottom curve) for a variable
star observed during Q1. This source displays periodic behavior with ~1% peak-to-peak amplitude
on a timescale of ~5 days. The figures show that the overall source variability is preserved by PDC.
Systematic noise introduced by an onboard heater can be seen as the short period wiggles
in the upper light curves. This noise is removed by PDC as the noise signal is correlated
with ancillary engineering data (Jenkins etal 2010).
Kepler is sensitive to an enormous volume of variability phase
space. At present, analysis of the appropriate level and specifics of systematic error
correction, for the full range of phase space sample by Kepler is incomplete. Overall, the
corrected light curves are excellent probes of the underlying variations on a wide range
of sources. In broad terms users should we cognizant of three types of phenomena for which the
validity of the corrected light curves warrant caution:
- Low amplitude (10s-100s PPM) variability with periods > 10 days.
- Strongly episodic variable stars, such as cataclysmic binaries. PDC may flag
eruptive phenomena as discontinuties, or attempt a fit which may unintentially
modify the data.
- Complex light curves, exhibiting multiple varying components, for example and
eclipsing binary with one or both components also variable.
Each of these situations describe astrophysically important
sources for Kepler's varied science programs, and considerable effort is ongoing to
address the fidelity of the systematic error corrections to (a) preserve instrinsic
signals, and, (b) not introduce false signals. These efforts include testing alternative
correction algorithms, and a series of numerical experiments in which test signals are inserted
into observed light curves and passed through PDC. Results will be posted here in the
near future.
|
