|
|
|
||

| |||
| Kepler Calibration | |||
| +Kepler Instrument Handbook |
|
INSTRUMENT RESPONSE Investigators can find current ascii tables behind the following links containing the Kepler instrument response curve in hi-res and low-res tabulations. |
|

|

|
|
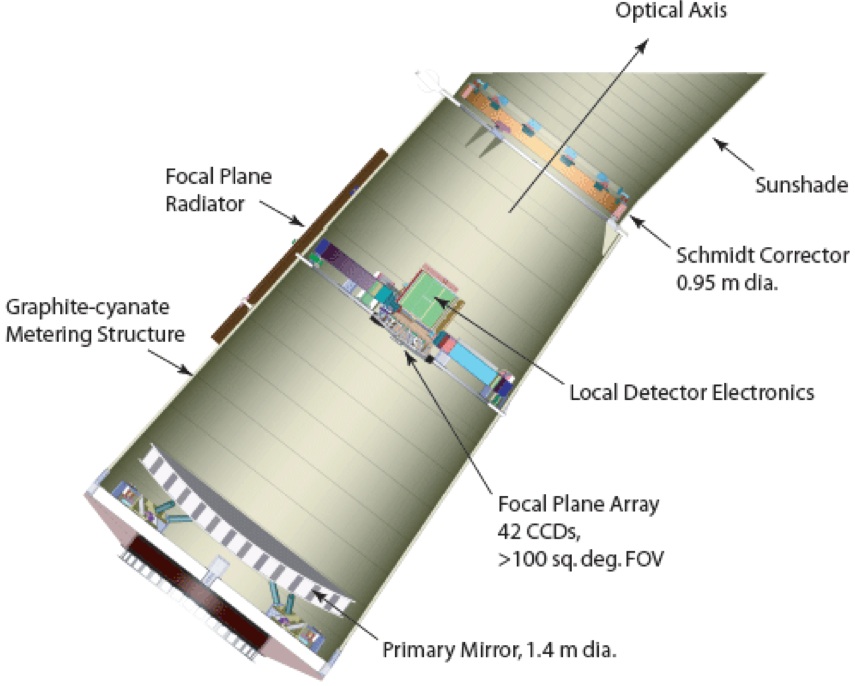
Figure 1: The Kepler focal plane detectors and the optical elements within the Kepler telscope. From the Kepler Instrument Handbook (KIH). The primary instrument aboard Kepler is the focal plane array consisting of 21 science and 4 Fine Guidance Sensor CCD modules. Field flattener lenses on each module map the spherical telescope image surface onto the flat CCD chips, and define the overall wavelength bandpass. Each science module is an array of 2200 by 2048 pixels. These 21 modules each have 4 output channels, for a total of 84 channels and 94.6 million active pixels that view the sky, with additional masked real pixels and virtual pixels for collection of collateral data. The shape of the bandpass, described below, was chosen to contain most of the optical spectrum. This choice maximizes the sensitivity of the telescope + detector combination for detecting planets transiting solar-type stars. Kepler contains no "true" filter, in the sense that HST imaging instruments include filter wheel assemblies with multiple, specifically-defined bandpasses. Here, the intent is to utilize the entire optical range, except for the short wavelengths, which were truncated to avoid chromspheric emission lines in solar-type stars. The photometer provides no color information, but does provide excellent depth. Kepler's wide-band images are similar to the clear filter frames taken with HST/STIS. |
|
|
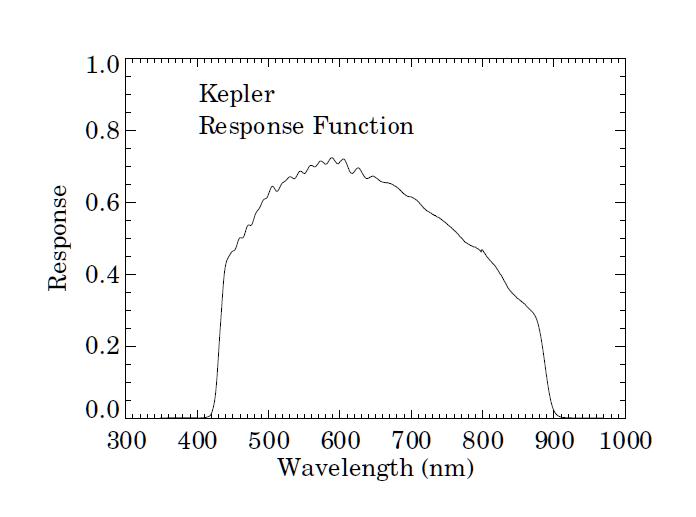
To achieve maximum sensitivity, the Kepler bandpass is wider than the typical broad-band filters commonly used in optical astronomy (e.g. Johnson UBVRI, Sloan ugriz). The absolute Kepler sensitivity curve is displayed in the clickable figure (Fig 2) to the right. The displayed response curve was derived during pre-flight testing, and represents the laboratory calibration of the Kepler photometer. Links to the tabulated values for the wavelength response are provided at the top of the page in both high- and low- spectral resolution forms. |

|

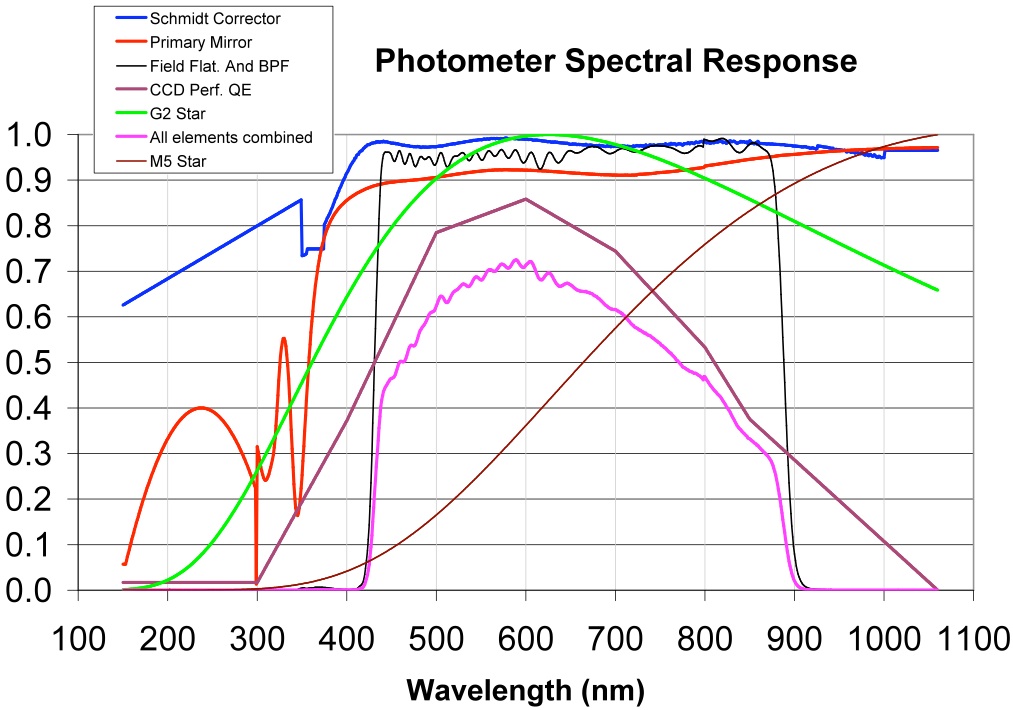
Figure 3: Optical element components of the Kepler Instrument Response compared to approximate M5 and G2 stellar spectra. |
|
|
The total photometer spectral response is a combination of the transmission functions of all optical elements, including the Schmidt corrector, the primary mirror assembly, the field flatterner lenses on each CCD module, and the wavelength dependent quantum efficiency of the detectors (Fig 3). The front surfaces of the field flatteners are anti-reflection coated; a bandpass filter coating was applied to the back surfaces. This bandpass was chosen to minimize the effects of stellar variability in the near-ultraviolet (λ ≤ 420 nm), especially the Ca II H & K emission lines, which would impact exooplanet transit detection. At long wavelengths the coating was designed to minimize fringing. |
|

|
|
|
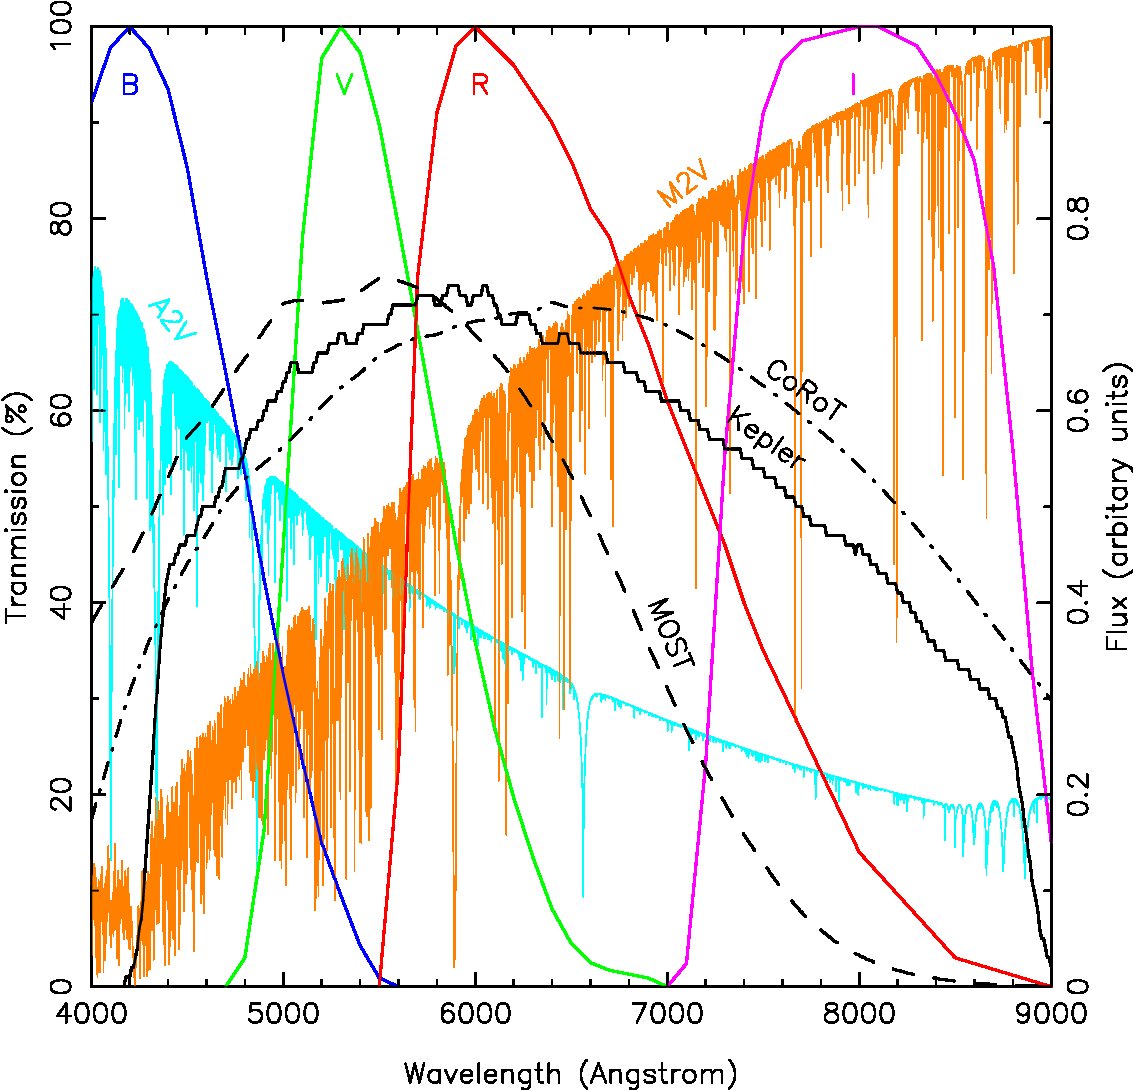
Fig 4: Comparison of the Kepler, MOST, CoRoT and Johnson response curves. Kindly
provided by Jason Rowe (NASA Ames) and extracted from
2009IAUS..253..121R.
Fig 4 compares the Kepler response function with those of two similar missions: the MOST spacecraft, and the CoRoT mission. The response functions for all three experiments are displayed from 4000 to 9000 Å. The MOST bandpass bandpass is marked by the dashed line, the Kepler bandpass is shown in black and the CoRoT bandpass is shown by the dot-dashed line. The transmission functions for the Johnson B,V,R,I filters are shown from left to right in blue, green, red and magenta respectively and have been scaled to peak at 100% transmission. The spectrum for an A2V star is shown in cyan, which peaks in the UV and the spectrum for a M2V star is shown in orange which peaks in the infrared. The two spectra have been scaled to have equal flux in the Johnson V filter. |
|
Questions concerning Kepler's science opportunities and open programs, public archive or community tools? Contact us via the email address.