|
|
|
||

| |||
| Kepler Calibration |
|
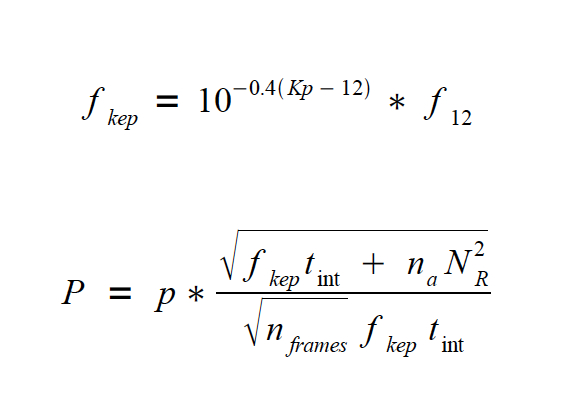
Signal-to-Noise Characteristics Identification of astrophysically interesting signals in the Kepler time series requires an assessment of the noise characteristics of the photometer. Users of Kepler data will need information about both the usual signal-to-noise issues, e.g., photon and read noise, background flux, and the temporal stability due to systematic and episodic noise sources. Detection of weak transits against a bright stellar background is the primary objective of the Kepler mission, therefore the photometric stability of the instrument was of paramount importance during the design phase. The Project is investing considerable effort to identify and account for systematic noise sources in the Kepler time series. These efforts are described in the Instrument Handbook, the Kepler Data Analysis Handbook (Fall 2010), and a series of data release notes, distributed when large datasets are released to the archive. Individual data release notes are found in the Data Release folder at MAST. Users of Kepler data are strongly encouraged to read these detailed descriptions. Pre-Flight Estimates The expected photocurrent of the source, expressed in electrons per second, is provide by the first expression. f12 is the benchmark photoelectron current at the focal plane for a G2 V with a Kepler magnitude (Kp) = 12.0, which is 1.74 × 10⁵ e-/s. This value is the best pre-launch prediction of the flux estimate, and may change as understanding of the photometer performance increases. An estimate of the precision is given in the second expression, where tint is the per-frame integration time = 6 seconds; nfr = the total number of frames in an observation; na is the number of pixels in the photometric aperture; Kp is the apparent magnitude in the Kepler bandpass; NR is the read noise = 120 e−, and p is an empirical constant, with a value between 1 and 2, designed to account for all other noise sources. A current estimate for p is 1.2, and, as with the benchmark photocurrent, may change with operational experience. The number of frames in an observation must also account for the CCD readout time, 0.66 seconds. There are 270 frames per 30 minute observation (1 long cadence), and 9 frames per 1-minute observation (1 short cadence). | ||||||||||||||||||||||||||||||||||||||||||||||||||||||||||||||||||||||||||||||||||||||||||||||||||||||||||||||||||||||||||
|
The table at right provides an estimate of this precision, P, expressed in parts per million. These values were derived using a nominal aperture, na = 20 pixels, and integration times of 60 seconds = 1 short cadence, 1800 seconds = 1 long cadence and 5 hours (10 long cadences, 18000 seconds). The derived values do not account for "noise" introduced by instrinsic variability in the observed sources, which, in general, will differ for different variability classes. Photometric precision estimates in the table should be considered applicable to quiescent sources. While intrinsic variability is a complication for transit detections; it is generally the property under study by guest observes. Note that 1 millimag ~ 1000 parts per million; 0.01 magnitudes ~ 104 parts per million. In practice, the target apertures, expressed in pixels, are adjusted for source brightness. Apertures decline with increasing magnitude, to minimize background and other noise sources when the expected signal will fall in a just a few pixels. As the program matures, we will provide additional estimates of the precision for a range of target apertures. The expression above provides an estimate of the precision for stars fainter than Kp ~ 12.0. For brighter sources the expression above becomes increasingly inaccurate. Bright star photometry is dominated by systematic effects rather than just photon and read noise. Users should utilize the table values with caution, and consult the Instrument Handbook for further details concering the issues relevant to bright source photometry.
|
| |||||||||||||||||||||||||||||||||||||||||||||||||||||||||||||||||||||||||||||||||||||||||||||||||||||||||||||||||||||||||
|
||||||||||||||||||||||||||||||||||||||||||||||||||||||||||||||||||||||||||||||||||||||||||||||||||||||||||||||||||||||||||
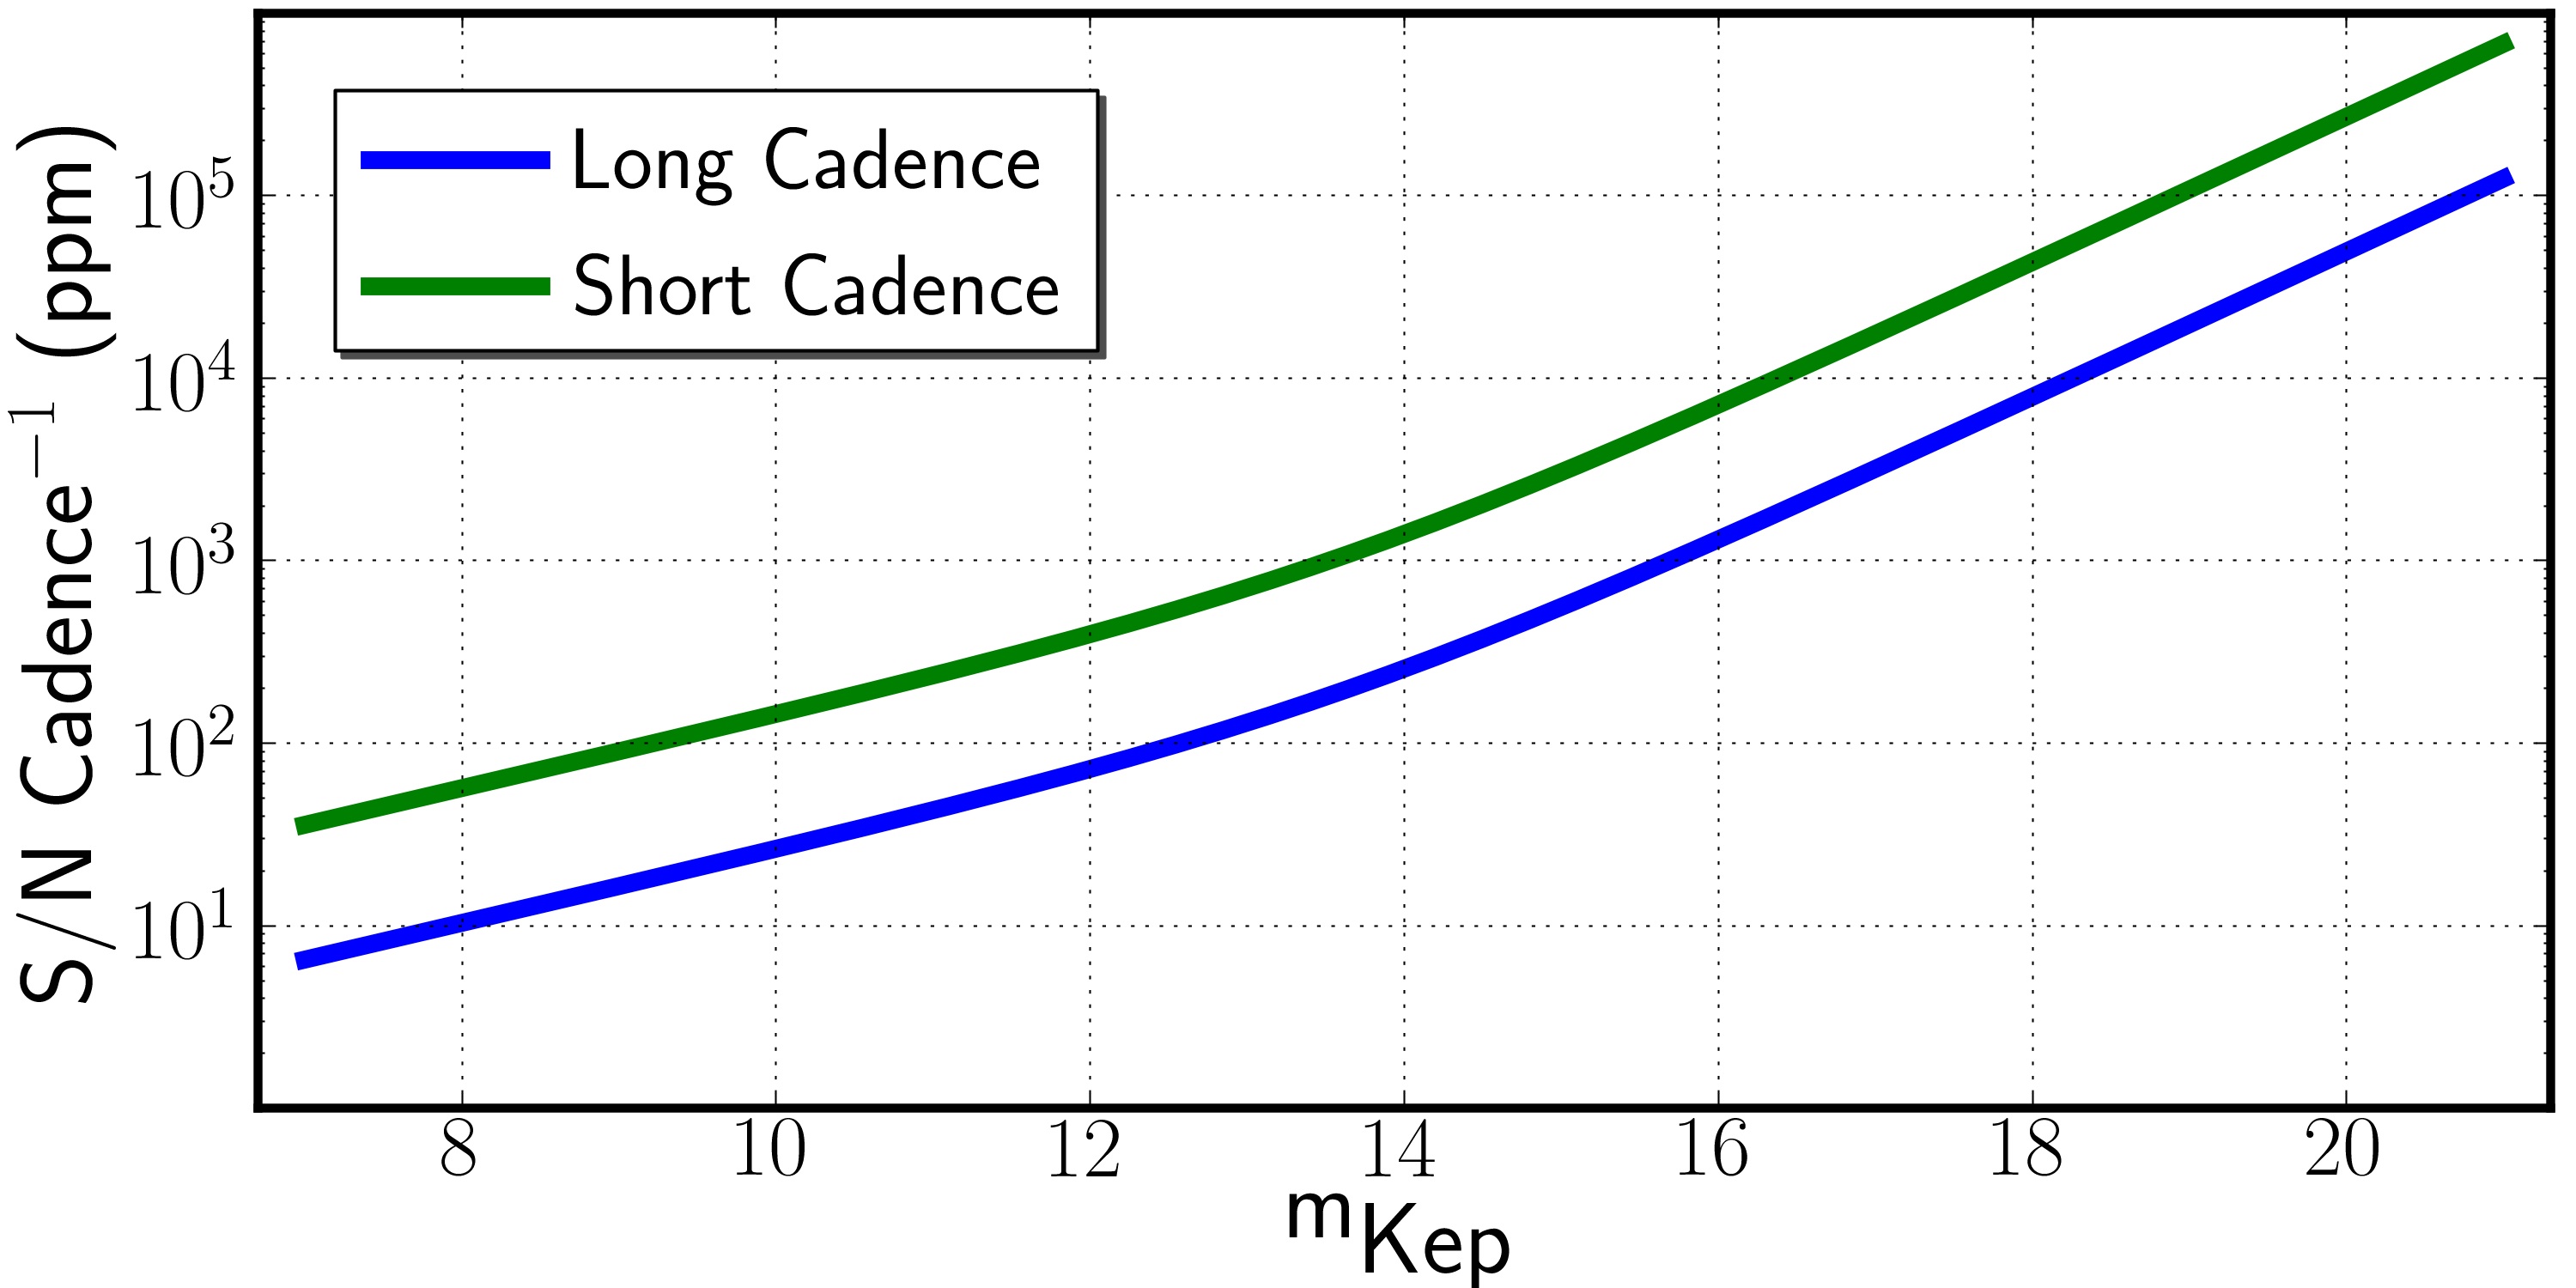
 Observations with the Kepler photometer are obtained in either a 1 minute ("short")
or 30-minute ("long") observation, termed a cadence. Both types of
observations may be
summed to improve the overall signal detection. A number of factors effect the
signal-to-noise ratio at both the bright and faint observing limits. A factor of
2 estimate of the photometric precision expected within either a single short or long
observation for isolated (uncrowded) FGK stars can be made using the expression
presented at left.
For cooler and hotter stars, these estimates may be subject to larger uncertanties,
reflecting the tranformation from gr magnitudes to the Kepler magnitudes.
Observations with the Kepler photometer are obtained in either a 1 minute ("short")
or 30-minute ("long") observation, termed a cadence. Both types of
observations may be
summed to improve the overall signal detection. A number of factors effect the
signal-to-noise ratio at both the bright and faint observing limits. A factor of
2 estimate of the photometric precision expected within either a single short or long
observation for isolated (uncrowded) FGK stars can be made using the expression
presented at left.
For cooler and hotter stars, these estimates may be subject to larger uncertanties,
reflecting the tranformation from gr magnitudes to the Kepler magnitudes.
|
Empirical Estimate | ||||||||||||||||||||||||||||||||||||||||||||||||||||||||||||||||||||||||||
|
Using flight data, we measured the observed precision to compare to the pre-flight estimate. As noted above, variations in the received signal are driven by photon statistics, instrumental uncertainties and intrinsic source variations. Intrinsic variability is present in many stars at unknown levels and will cause estimates of the overall precision, measured in PPM, to be larger than that ratio defined by the sum of photon statistics, instrumental and spacecraft-induced limitations. Note that the estimate provided above is calculated for a single observation, either a 9-frame short cadence or a 270-frame long cadence. The onboard solid state recorder accumulates all CCD reads in each cadence; the individual frames are not stored for later downlink and analysis. Therefore we cannot directly measure the precision within a single cadence observation by averaging the frames within that cadence. Measurements of the signal variations using a variety of timescales provide a sense of the overall precision of Kepler light curve. For this measure of the precision, we selected 23 cool dwarfs, all but the faintest three within a temperature range 5700 < Teff < 6000, and log g > 4.0, as listed by the Kepler Input Catalog. The choice of parameter range was driven by the desire to select stars with minimal intrinsic variations (ie., no giants), and to compare stars of similar physical properties. These stars are nominally early-G dwarfs. The table at right provides a measure of the observed precision, P, expressed in parts per million for long cadence data. These values were derived from the Q2 light curves after processing through the pixel calibration (CAL), photometric analysis (PA), and pre-search data conditioning (PDC) modules within the Kepler pipeline. The Kepler magnitude of each source is tabulated, along with the observed count rate, and precision. Counts are the median value measured for one long cadence as output by PDC, averaged over an entire quarter, presented in electrons/cadence. The precision, expressed in parts-per-million, is the variance of the counts, again averaged over an entire quarter. These values are intended to provide a straighforward meaasure of the noise in the long cadence light curves; in the future we will provide estimates over a broader range of timescales. The observed count rate per second, interpolated from the pipeline output through the PDC step, at a Kepler magnitude = 12.0, = 1.72 × 10⁵ e-/s. This value agrees to within 1% with the value estimated from the pre-flight instrument characterization, described above. Note that output from the pipeline Photometric Analysis (PA) module will generally display a larger count rate. The PDC module corrects for light in the source aperture arising from surrounding stars,based on a derived source-specific crowding metric. Isolated sources will show the same count level, while crowded stars may have a significant reduction in the observed source flux. PA produces a sum of counts within the optimal aperture, with no correction for nearby sources. The measured precision tracks the pre-flight estimates, with signifcant deviations at the bright end. As noted above, the expression used for deriving the expected precision break down at bright magnitudes, largely due to the larger apertures used for bright sources (not reflected in the calculation above), pixel saturation and other systematic effects. The values to the right were derived using data for most of a quarter, excluding data gaps due to safe modes, loss-of-pointing, and the monthly downloads. A few of the selected stars showed significant intrinsic variations during Q2. We retained those stars in order to demonstrate the effect of variability on simple measures of the precision. The source at Kp = 14.35 turned out to be an eclipsing binary; the source at Kp = 15.69 showed a long-period change in the observed count rate. The values displayed in the plot for these two source reflect a measure of the precision excluding most of the observed large amplitude variability (the precision for these two objects was estimated by dividing the light curve into ~25 3-day segments, and deriving the median value of the measured variance). |
|

|

|
|
Observed count rate, expressed as log photoelectrons electrons per cadence (one 30-minute observation), as a function of Kepler magnitude for the full brightness range of sources observed by Kepler during Quarter 2. This dataset consisted of 23 solar analogues with 5700 < Teff < 6000, and log g > 4.0, as listed in the Kepler Input Catalog. |
|
The photometric precision, expressed in log parts per million, (Log PPM) for the sources displayed to the left. Values are given in the tables listed above. The points indicate an empircal measurement over an entire quarter (excluding data gaps). The line indicates the precision calculated from the expression given above, for a single 30 minute observation, 1 long cadence. Note that the calculation used a single, 20-pixel aperture for each integration, a choice generally applicable to stars in the range 11 < Kp < 14. The divergence of the calculated value from empirical measures at the bright end is due to the larger apertures used for brighter sources and the onset of saturation in the center pixels for these sources. |
|
|
Observing Limits
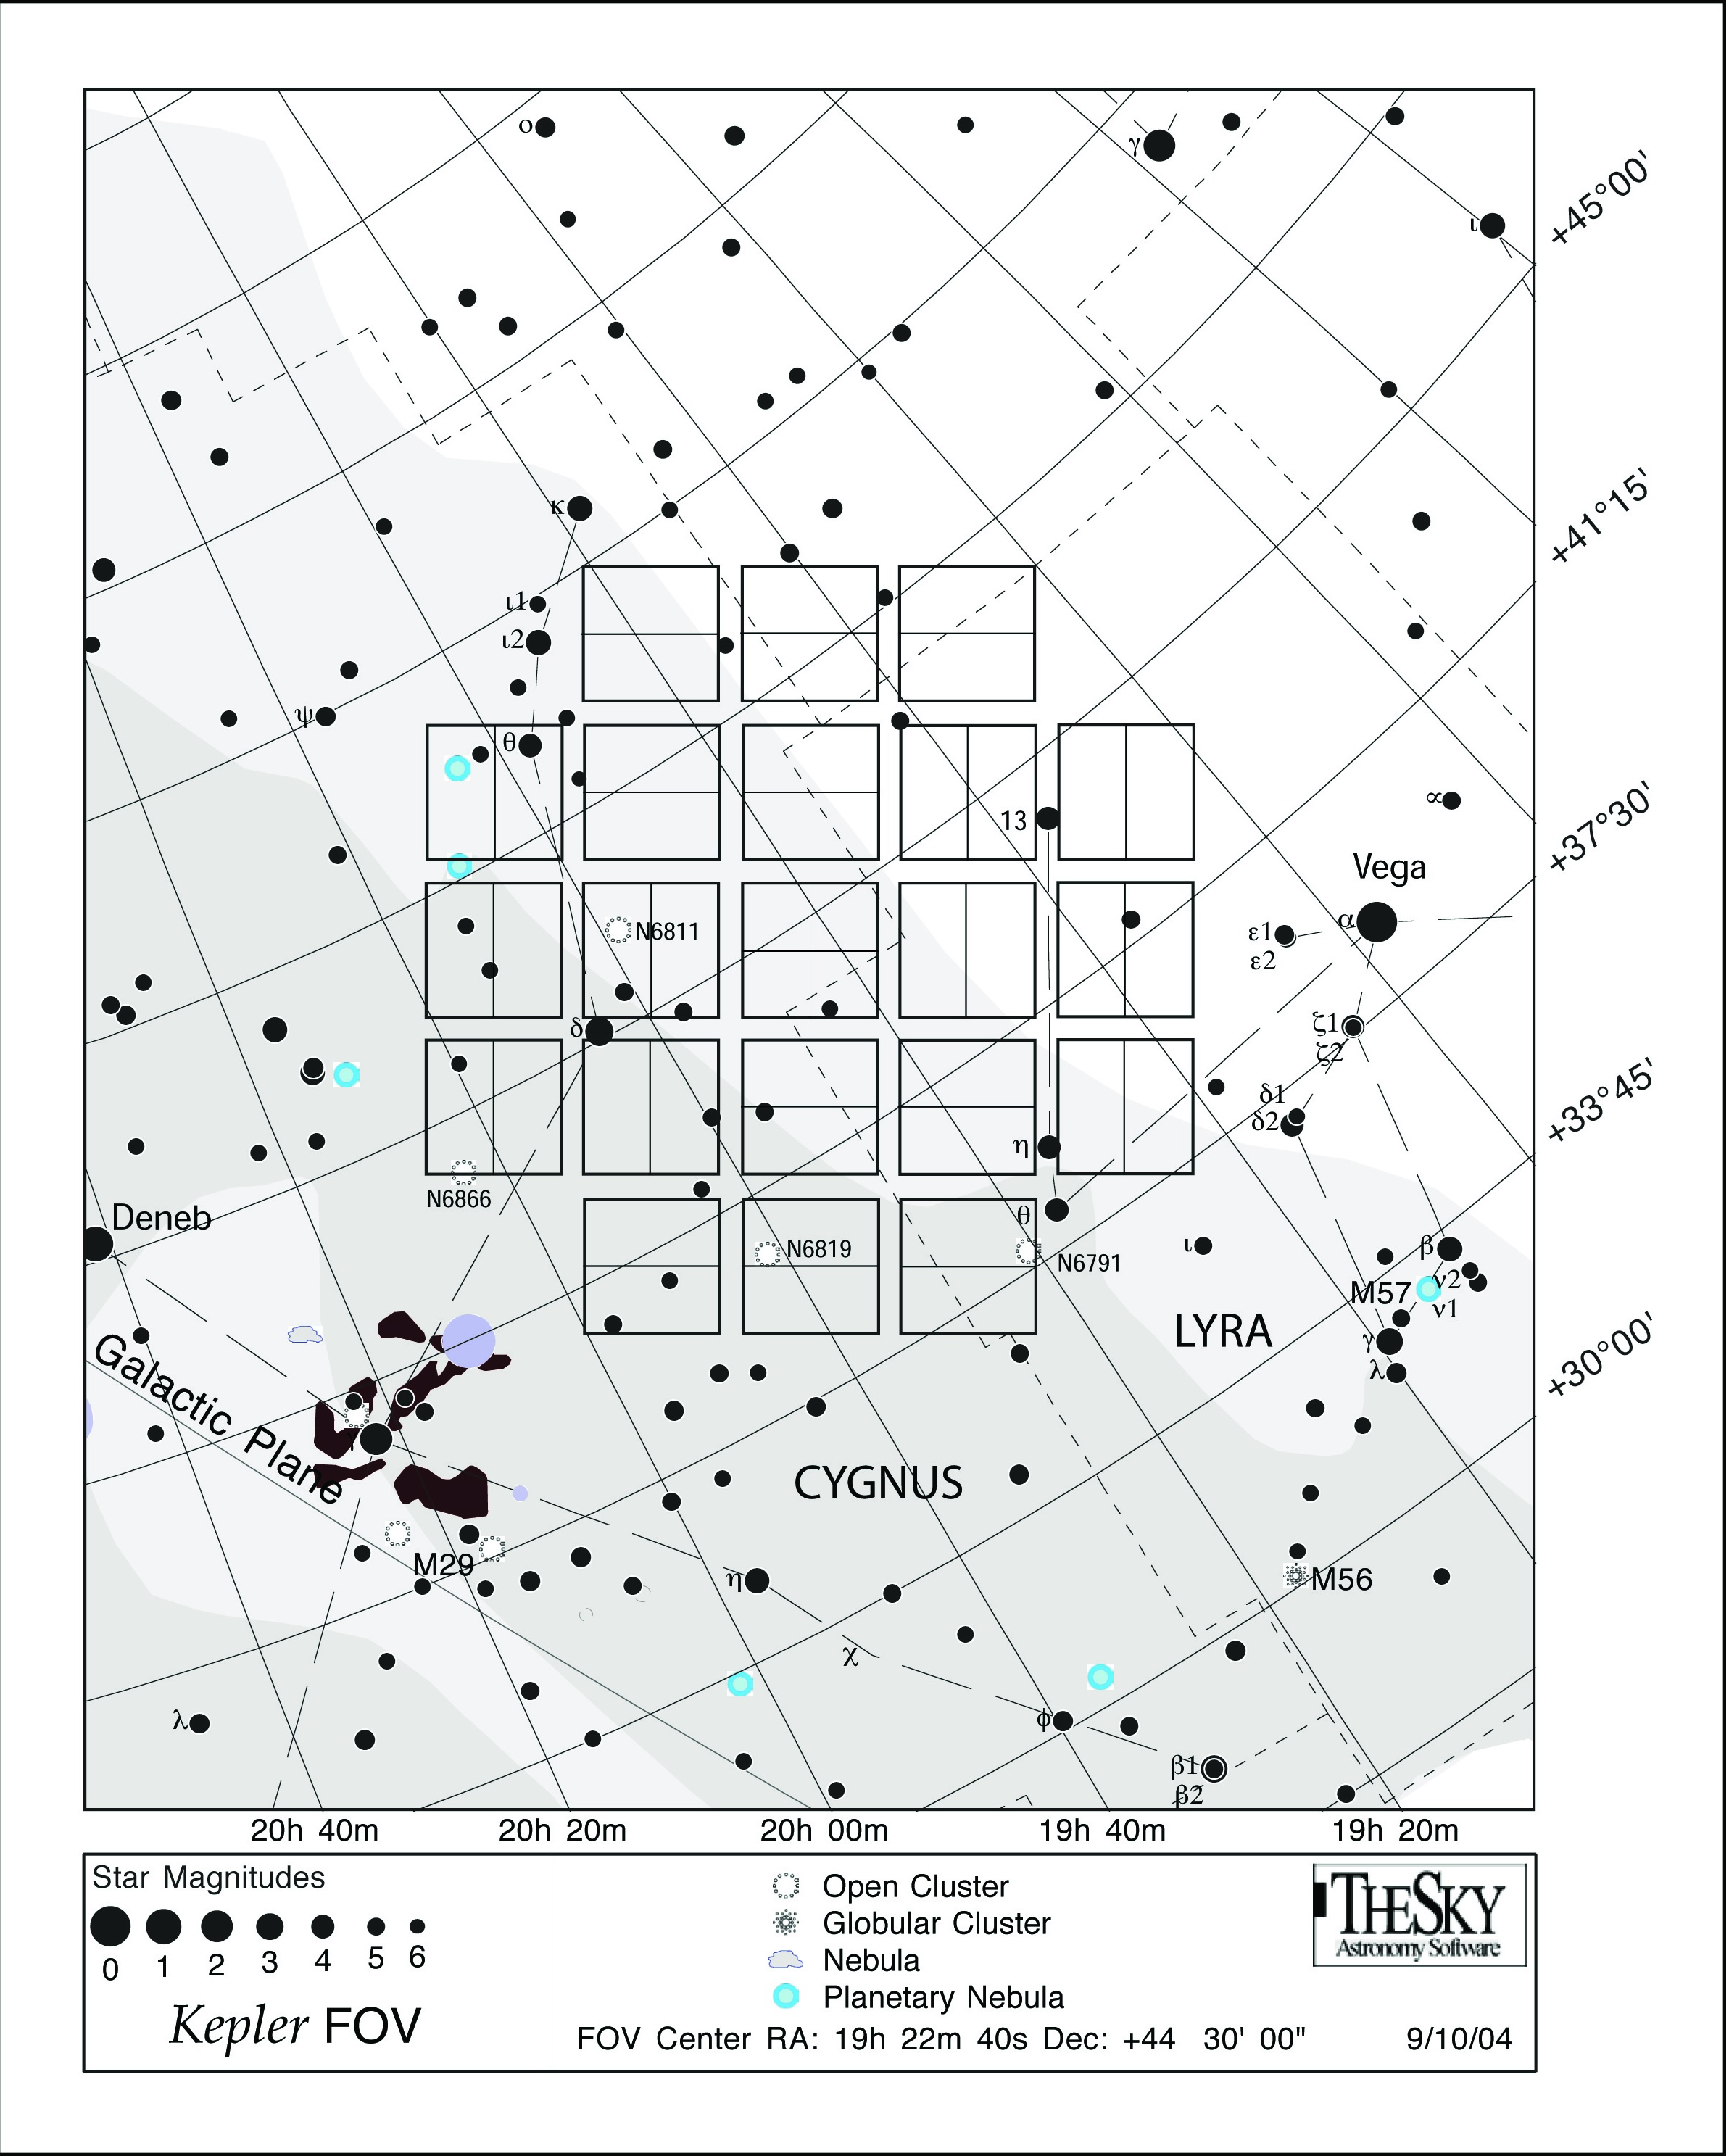
The limiting factor for observations of faint sources is set by source confusion, rather than the photometric accuracy computed for isolated sources. Users wanting to observe objects with Kepler magnitudes less than 17.0, should carefully examine the field around their source, and estimate the contamination from the PSFs of surrounding objects. Note that an estimate of the crowding metric is provided for most sources brighter than Kp = 17.0 in the Kepler Target Catalog, look under the field labeled "Contamination" in the output of a target search. Contamination is defined as (1 - crowding_value), where the crowding value was derived when the Kepler Target Catalog was created. A value of 0 implies no contamination, 1 implies essentially all background, i.e., complete contamination of the source by surrounding objects. For fainter sources, observers can estimate the contamination using imagery from the Digital Sky Survey, supplemented with the Kepler Full Frame Images (FFIs) as the latter become available. |

|
|
Three views of a portion of a Kepler CCD, scaled to illustrate source crowding at faint magnitudes. White on the grey scale indicates that the source flux exceed the maximum value shown. For bright sources the observed signal in the central pixel(s) will increase linearly until the well depth is reached. Beyond that level, charge will bleed into adjacent pixels in the column containing that source. However, even when the central pixel is saturated, the target aperture can extend along the bleed column, preserving most or all of the signal from the source. Guest observers may propose for bright stars, with the caveats that these sources are expensive in pixel terms. A custom aperture may be required, and the project cannot guarentee that a custom aperture can be created for the proposed observations. |

An example of charge bleed in a Kepler image. A single output channel is displayed after 270, 6-second integrations. |
Questions concerning Kepler's science opportunities and open programs, public archive or community tools? Contact us via the email address.