|
|
|
||

| |||
| PyKE Primer - 5. Cotrending Basis Vectors | |||
|
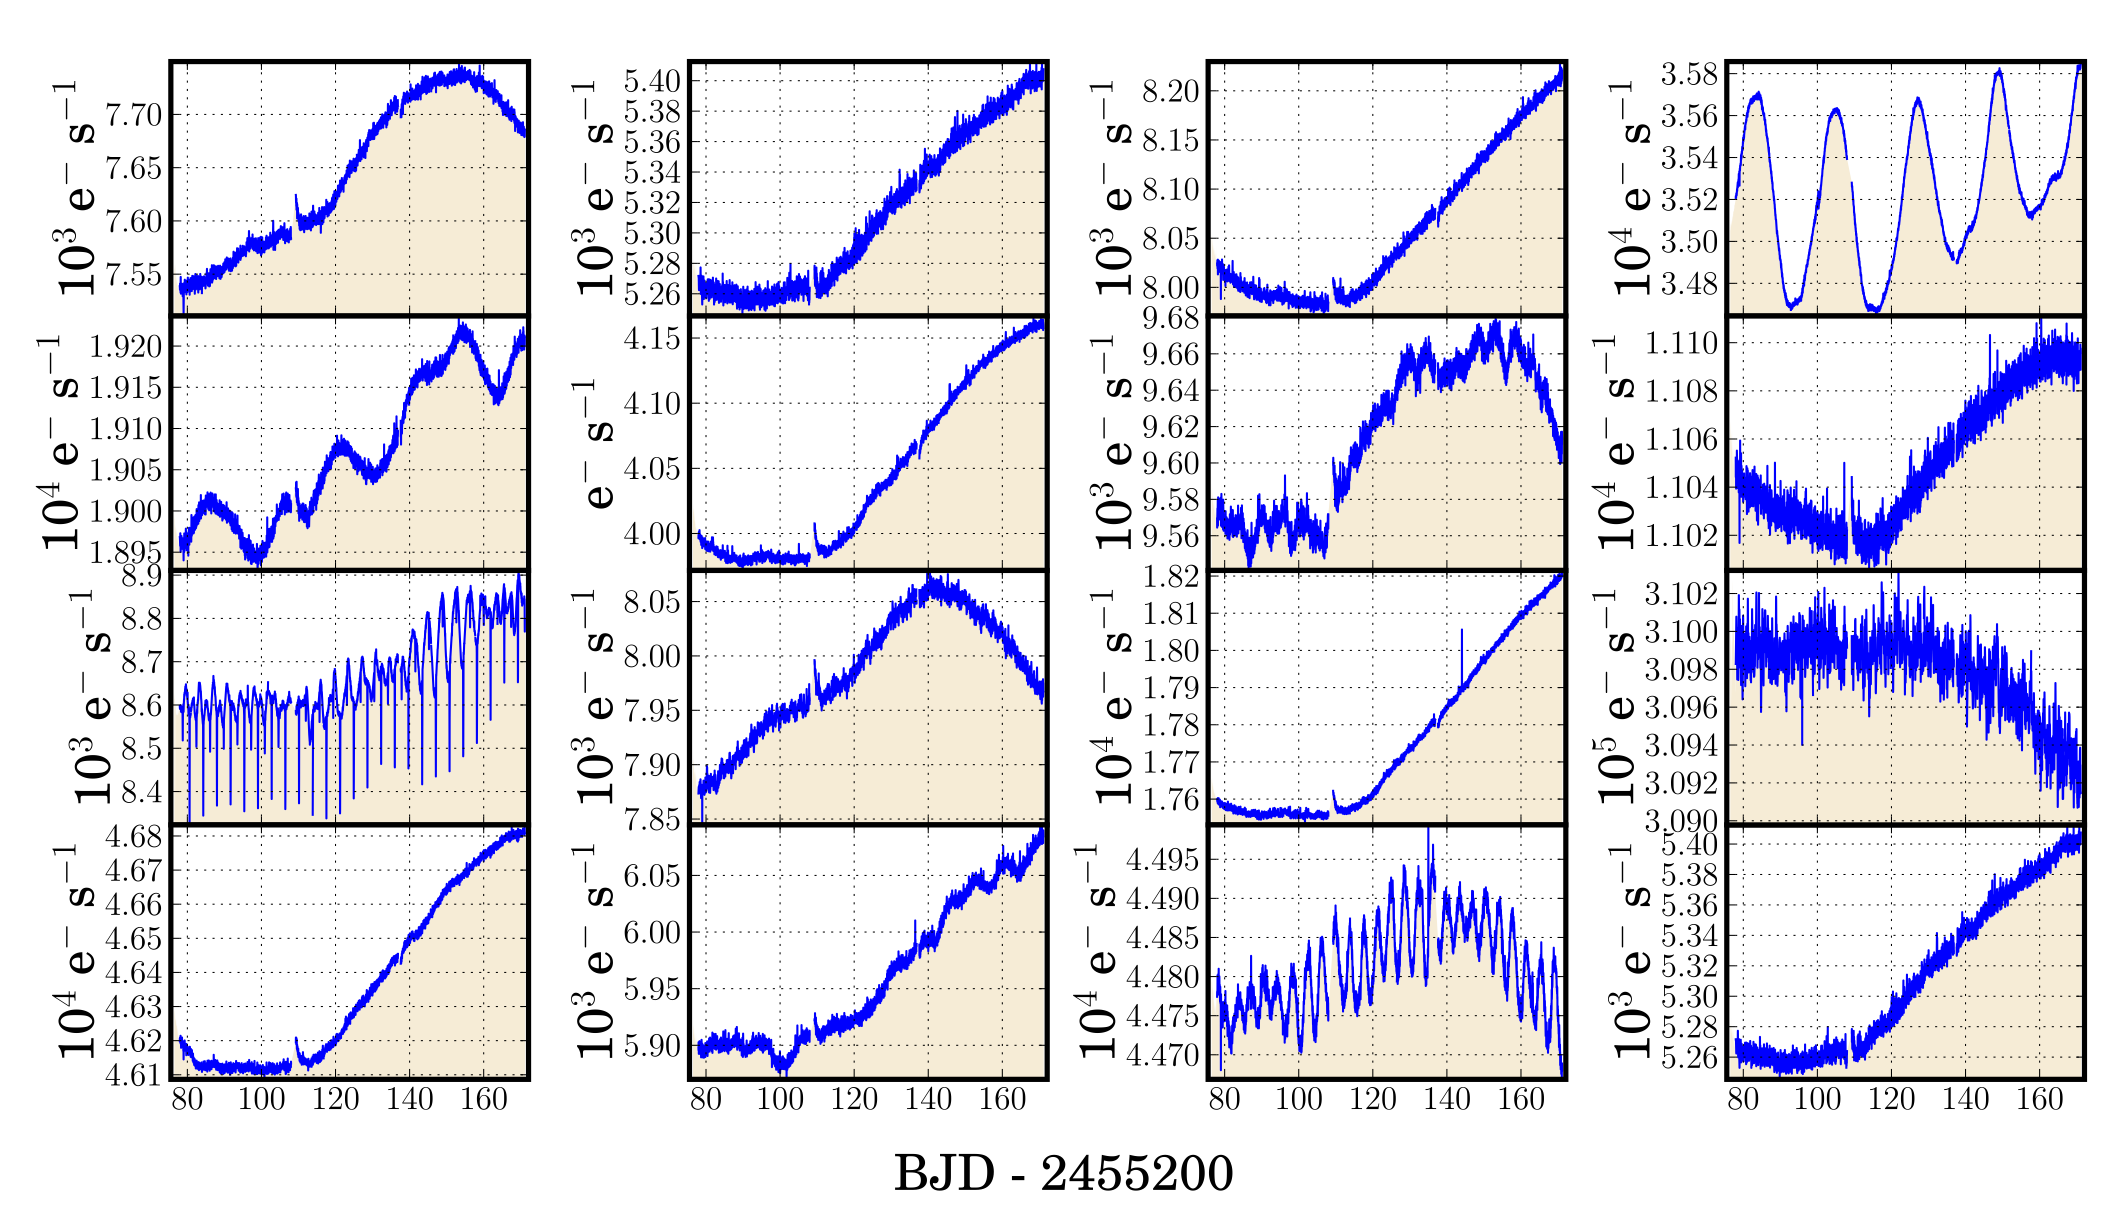
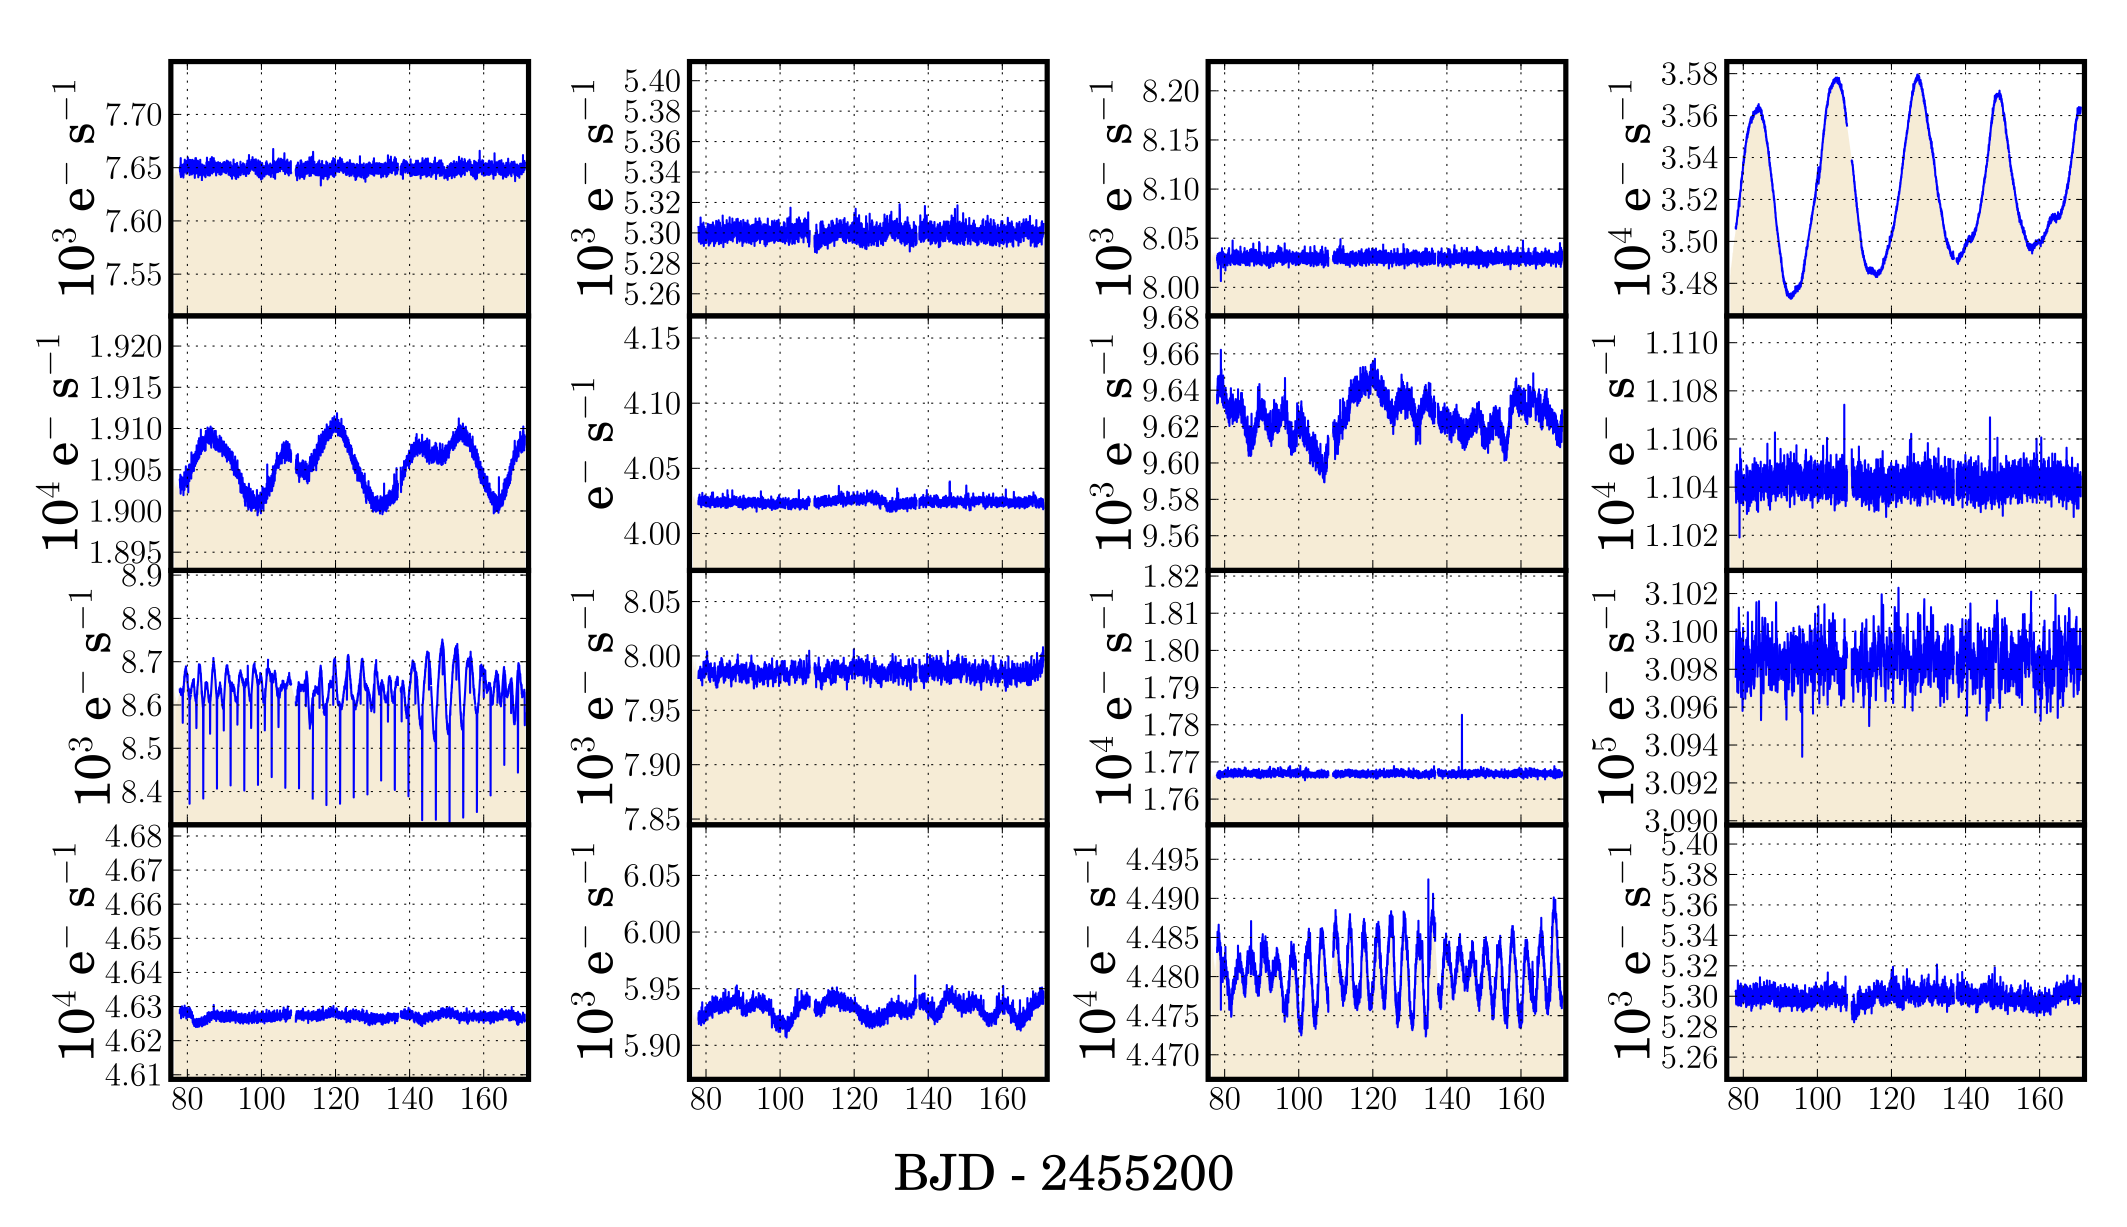
The 16 most significant CBVs per channel over each quarter are calculated by the Kepler pipeline and packaged as FITS binary files. These CBVs are available for download at MAST. File content and format are described in the Kepler Archive Manual - Fraquelli & Thompson (2011). With the provision of CBVs, the responsibility rests with the archive user to either improve upon the existing artifact mitigation done by the pipeline or perform manual artifact removal from photometry re-extracted from a TPF. Basis vectors are usually fit to the SAP light curve linearly, i.e. each basis vector is scaled by a coefficient and subtracted from the flux time-series. Computationally, the most efficient method is a linear least-squares fit. In Figure 4 we plot 16 SAP light curves from channel 50 in quarter 5. In Figure 5, we plot the same light curves of Figure 4 but with the most significant CBVs fit and subtracted. We can see that in all the light curves in Figure 5, the systematic trends have been greatly reduced. 
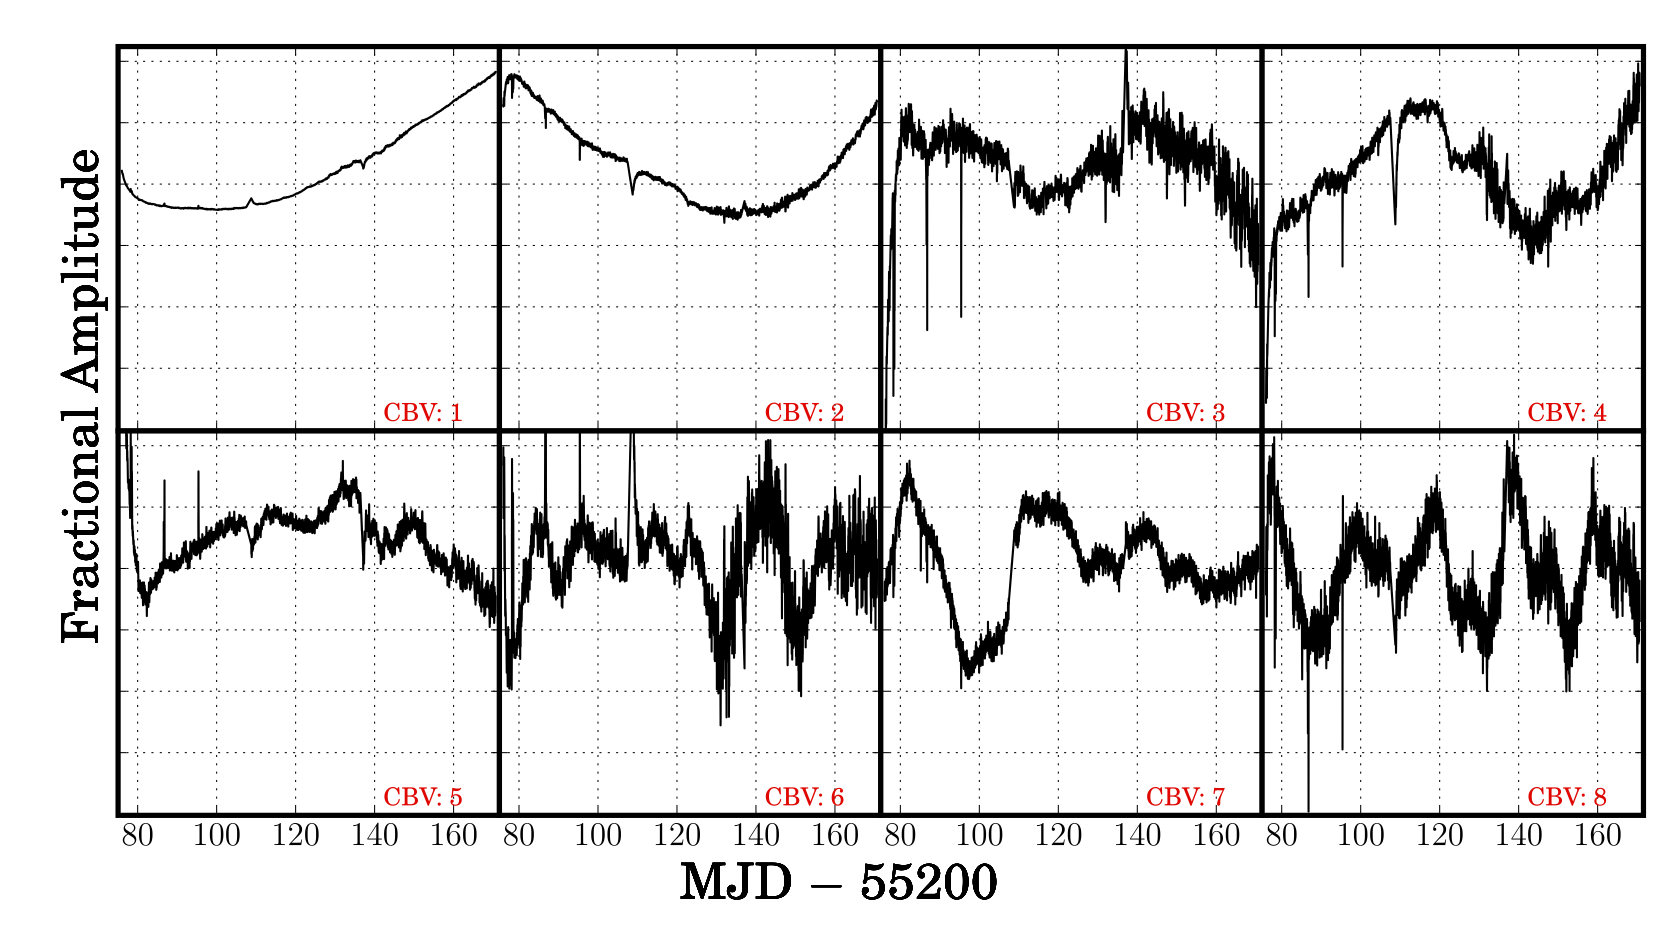
Figure 3: An example of eight cotrending basis vectors with the highest principle values, or contribution to systematic variability, from channel 50 over operational quarter 5. Basis vectors run from left-to-right, top-to-bottom, in order of significance. Each basis vector is normalized and median-centered about zero. Basis vectors can be linearly-fit to a light curve and subtracted to mitigate for systematic effects. The fit coefficients can be positive or negative. 
Figure 4: Sixteen long cadence light curves chosen at random from quarter 5, channel 50. All light curves show some degree of correlation. The most obvious common feature is an increase in the flux level over the course of the quarter. This is the manifestation of differential velocity aberration. 
Figure 5: The sixteen quarter 5 SAP light curves presented in Figure 4 after best-fit CBV ensembles have been subtracted. An important decision for the CBV user is how many basis vectors to fit and remove from the SAP data. Fitting too few will capture instrumental artifacts less effectively. However, using too many can over-fit the data, removing real astrophysical features. A further consideration is that no basis vector is perfect. The inclusion of each additional CBV to the fit adds a noise component to the data. The choice of CBV number is in reality a trade between maximizing the removal of systematics on the one hand, and avoiding the removal of real astrophysics and minimizing the effects of CBV noise on the other. A minimum of two basis vectors should be fit to the data because, instead of strictly enforcing a constant first or second basis vector, CBVs are created by mixing a constant offset with the strongest non-constant basis vector. A sequential method is the most effective approach, starting with two basis vectors and increasing the number of vectors monotonically until deciding upon a subjective optimal fit. Occasionally the linear least-squares fit is not sufficient, and a more robust fitting method must be utilized. One option is to fit the CBVs to the SAP time-series using an iterative-clipping least-squares method. This method identifies data points outside of a distance threshold from the best fit. Data points outside of the threshold are excluded and the fit recast. This procedure iterates until no further data points are rejected and is more robust to outliers than a regular least-squares fit. Alternatively, rapid, high amplitude astrophysical variability can bias the goodness of fit away from the best astrophysical solution. Some sources of astrophysical variability, such as large amplitude, semi-regular variable stars, cannot be corrected satisfactorily with CBVs. Such sources which vary on a similar timescale to the length of a quarter are particularly problematic because the astrophysical signal has the same frequency as the most dominant basis vector. In addition, if the astrophysics is too similar in structure to the trends created by differential velocity aberration, cotrending corrections with CBVs may not be adequate. In these cases, we do not recommend using the CBVs to mitigate for long-term artifacts. The CBV method for removing systematic trends relies on there being a large number of stars on a channel to well-describe the common systematic effects present in the data. There are only 512 stars observed in short cadence mode at a given time, thus there are not enough stars on a single channel to fully capture the systematics present over 1-min cadence. The method currently available for mitigating short cadence artifacts is to interpolate the long cadence basis vectors over the short cadence timestamps. Artifacts on timescales less than 30-min cannot be removed from short cadence data using the CBV method. Previous: Light Curve Files Up: PyKE Primer Next: Quarter Stitching |
Questions concerning Kepler's science opportunities and open programs, public archive or community tools? Contact us via the email address.