|
|
|
||

| |||
| PyKE Primer - 6. Quarter Stitching | |||
|
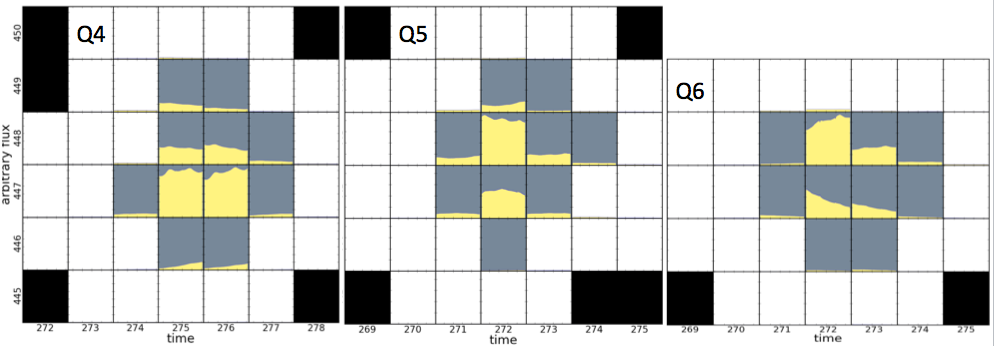
Systematic photometric artifacts result directly from the motion of targets within their pixel apertures due to differential velocity aberration, spacecraft pointing, and focus variations. Similar in nature, Kepler data will often exhibit discontinuities across the data gaps that coincide with the quarterly rolls of the spacecraft. After each roll maneuver, most Kepler targets fall on a different CCD channel and the target’s point-spread function will be distributed differently across neighboring pixels. Naturally this redistribution requires a new computation of the target mask and optimal aperture size within the Kepler pipeline, taking into account the point-spread function, new CCD characteristics, and new estimates of nearby source crowding. The operational outcome is often a different mask shape, with differing amounts of flux within the optimal aperture from both the target and contaminating sources. An illustrative example of this problem is provided by the quarter 4-6 calibrated pixels collected for the symbiotic star StHA 169 (KIC 9603833), plotted in Figure 6. 
Figure 6: Light curves extracted from all single pixels within the quarter 4, 5 and 6 Target Pixel Files for KIC 9603833 (the symbiotic star StHA 169). Gray pixels comprise the optimal apertures that yield the archived light curves. The target point-spread function is distributed across neighboring pixels differently from quarter to quarter and hence the optimal aperture varies in size and shape from quarter to quarter. The amount of target flux falling outside of the optimal aperture is quarter-dependent. Data are not collected from the black pixels. The plots were created with the keppixseries PyKE task, using the plottype=global option. There are several methods available to attempt correcting for photometric discontinuities across the quarter gaps. None of the methods are well-suited to all occasions. Individually they can perform good corrections under specific conditions. We discuss the three methods below. 6.1 Crowding and Flux Fraction Keywords It can be possible to align different quarters using the time-invariant approximations for crowding and aperture flux fraction stored within the light curve FITS file keywords. These unit-less keywords are stored in all Kepler light curve data. The same quantities are populated in the meta-tables of the data search and retrieval page at MAST. The FITS keyword FLFRCSAP contains the fraction of target flux falling within the optimal aperture. The keyword CROWDSAP contains the ratio of target flux relative to flux from all sources within the photometric aperture. Both quantities are the average value over each quarter and are estimated using point-spread function and spacecraft jitter models (Bryson et al. 2010) combined with source characteristics found within the KIC (Brown et al. 2011). The PDC time-series data archived within the FITS light curve files have both of these corrections applied by default. Both corrections can be applied to SAP data manually using the keparith task within the PyKE package. This method has critical limitations. The corrective factors supplied are model-dependent. The characterization of the Kepler point-spread function does not provide the same order of photometric precision as aperture photometry. The quality of model fits depend upon the completeness of the KIC within the region of the target. Secondly, the corrective factors are averaged over time, whereas in reality they vary from timestamp to timestamp as the field moves within the aperture. Furthermore, as the target and neighboring stars vary independently, the crowding correction in reality is an additive one rather than multiplicative. Therefore, while these two keywords collectively provide the simplest method of quarter stitching, the solution is often inadequate. Given that target images for each timestamp are provided in the archive within the Target Pixel Files, there is some scope for Kepler users to improve upon these corrections by fitting a field and point-spread function model to the individual images within these files. The Pixel Response Function (the combination of point-spread function and spacecraft jitter) information is available at the MAST archive within the focal plane characteristics download table. Fitting a PSF model can yield improvements over the provided correction factors because the time-dependent variations associated with the problem are mitigated, and the user can take individual care characterizing all neighboring sources contributing to flux within the aperture. The primary limitation remaining after these improved steps will be the accuracy of the point-spread function model./p> 6.2 Selecting and extracting different pixels A method which often proves successful is increasing the number of pixels within the target mask using the PyKE tasks kepmask and kepextract. This approach will prove adequate if the optimal aperture can be increased to a large enough size as to make target flux losses out of the aperture negligible, while avoiding significant contamination from nearby sources. This method will introduce additional shot noise into the resulting light curve by the inclusion of more source and background flux. The example of StHA 169 over quarters 4-6 yields an adequate correction by this method, as demonstrated in Figure 7. 
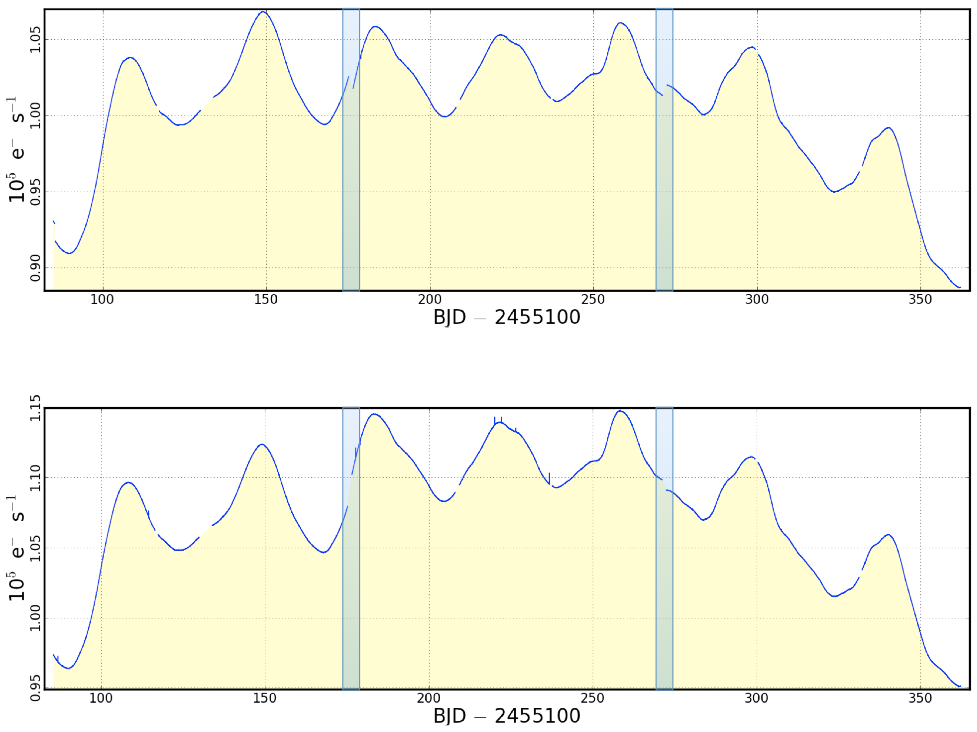
Figure 7: Upper: The archived SAP quarter 4, 5 and 6 light curves for KIC 9603833. Each light curve was extracted from the optimal apertures (gray pixels) defined in Figure 6. Photometric discontinuities occur at each quarterly roll due to the redistribution of target flux over a new CCD (indicated by the blue transparent areas), and the redefinition of the optimal aperture. Lower: Quarterly roll discontinuities are reduced by re-extracting the three light curves over all available pixels in the target masks. In this specific example, the redefined optimal aperture collects more of the target’s flux without introducing significant contaminating flux from nearby sources. Extraction was performed using the PyKE kepextract task with the maskfile=all parameter. 6.3 Light curve normalization A third approach that can yield adequate results is to individually normalize light curves on either side of a quarter gap by a functional fit or statistical measure of the data. Some simple corrections by statistical representations of the data, such as mean, median and standard deviation, are available through the PyKE tools such as keparith. Polynomials can be subtracted using the PyKE tool kepdetrend. These methods of correction are however mathematical conveniences and users should remain aware of the non-physical biases that they may introduce into the data. Previous: Cotrending Basis Vectors Up: PyKE Primer Next: Walk-through Examples |
Questions concerning Kepler's science opportunities and open programs, public archive or community tools? Contact us via the email address.