|
NAME
kepdetrend -- Detrend aperture photometry data
USAGE
kepdetrend infile outfile datacol errcol ranges1 npoly1 nsig1 niter1
ranges2 npoly2 nsig2 niter2 plot clobber verbose logfile
status
PARAMETERS
infile = string
The name of a MAST standard format FITS file containing a Kepler light curve
within the first data extension.
outfile = string
The name of the output FITS file. outfile will be an
amended version of infile with specified time ranges
detrended by subtraction of a polynomial fit.
datacol = string
The column name containing data stored within extension 1 of infile.
This data will be detrended. Typically this name is
SAP_FLUX (Simple Aperture Photometry fluxes), but any
data column within extension 1 of the FITS file can be corrected.
errcol = string
The uncertainty data coupled to datacol. Typically this
column is called SAP_FLUX_ERR. If no errors are
associated with datacol then use errcol=None.
ranges1 = string
The user must choose here specific time ranges of data to detrend. Ranges can
be supplied using one of two methods.
- Time ranges are supplied as comma-separated pairs of Barycentric Julian
Dates (BJDs). Multiple ranges are separated by a semi-colon. An example
containing two time ranges is:
'2455012.48517,2455014.50072;2455022.63487,2455025.08231'.
If the user wants to correct the entire time series then providing
ranges = '0,0' will tell the task to operate on the whole time
series.
- The user can provide time ranges within a pre-prepared ascii file containing
one time range per line, e.g.:
2455012.48517,2455014.50072
2455022.63487,2455025.08231
etc
The file 'arbitraryname.txt' is provided to the task using ranges1 =
@arbitraryname.txt, where the '@' tells the task that a file is being provided.
Files containing time ranges can be generated manually or with the aid of
data inspection using the task keprange.
npoly1 = integer
The polynomial order for the function that fits the data ranges
to be detrended.
nsig1 = float
The data to be detrended is fit by a polynomial using an
iterative scheme. After a best fit is found, those data points
deviating from the fit by more than this specified amount are
rejected and the remaining data are fit again, etc, until there are no
further rejections. This threshold is in units of the standard
deviation of the data about the best fit function.
niter1 = integer
The polynomial fit over the data to be detrended will be
iterated until there are no further outlier rejections or the
number of iterations exceeds niter1.
ranges2 = string
The function and syntax of this argument is identical to
ranges1, but it pertains to user-defined ranges that will
be fit by a polynomial to characterize the correct data
trend. Data within the range ranges1 will be detrended by
subtracting the difference between the best fit to data in that
range and the best fit function in the range ranges2
extrapolated into ranges1.
npoly2 = integer
The same as for npoly1 but pertaining to the data in ranges2.
nsig1 = float
The same as for nsig1 but pertaining to the data in ranges2.
niter1 = integer
The same as for niter1 but pertaining to the data in ranges2.
popnans = boolean
Keep NaN flux values (times without a flux measurement) in the output FITS file. If set to no, any rows in the input FITS file containing NaNs will no be in the output file.
plot = boolean
Plot the data, the fits and the correction?
clobber = boolean (optional)
Overwrite the output file? if clobber = no and an existing file has
the same name as outfile then the task will stop with an error.
verbose = boolean (optional)
Print informative messages and warnings to the shell and logfile?
logfile = string (optional)
Name of the logfile containing error and warning messages.
status = integer
Exit status of the script. It will be non-zero if the task halted with an
error. This parameter is set by the task and should not be modified by the
user.
DESCRIPTION
Simple Aperture Photometry (SAP) data can contain a series of
systematic trends associated with the spacecraft, detector and
environment rather than the target. Within the Kepler pipeline
these contaminants are treated during Pre-search Data
Conditioning (PDC) and cleaned data are provided in the archived
files as the PDCSAP_FLUX data. See the Kepler
Data Characteristics Handbook for more precise descriptions of
systematics. The Kepler pipeline attempts to remove systematics
with a combination of data detrending and cotrending against
weighted cotrending basis vectors derived from the time series structure most-common to all neighbors of the scientific target. These processes are imperfect but tackled within the pipeline in the
spirit of correcting as many targets as possible with enough
accuracy for the mission to meet exoplanet detection
specifications. This approach is, however, not optimized for individual
targets. Users of the Kepler archive may well find that
individually-tailored detrending and cotrending yields corrected
light curves more suited to their science. The purpose of
kepdetrend is to provide a detrending algorithm that can
be tailored for individual targets. We stress that an absolute
correction is often impossible for Kepler data. We also recommend the use of kepcotrend instead of kepdetrend for systematic removal in most Kepler targets.
The current version of this task asks the user to define data
ranges that are free of a systematic feature that needs to be removed
and can be well-characterized by a single polynomial function. This
function is what the task attempts to correct data to. The user then
defines a data range that needs correcting and fits this with a second
polynomial. The correction is the subtraction of one polynomial from
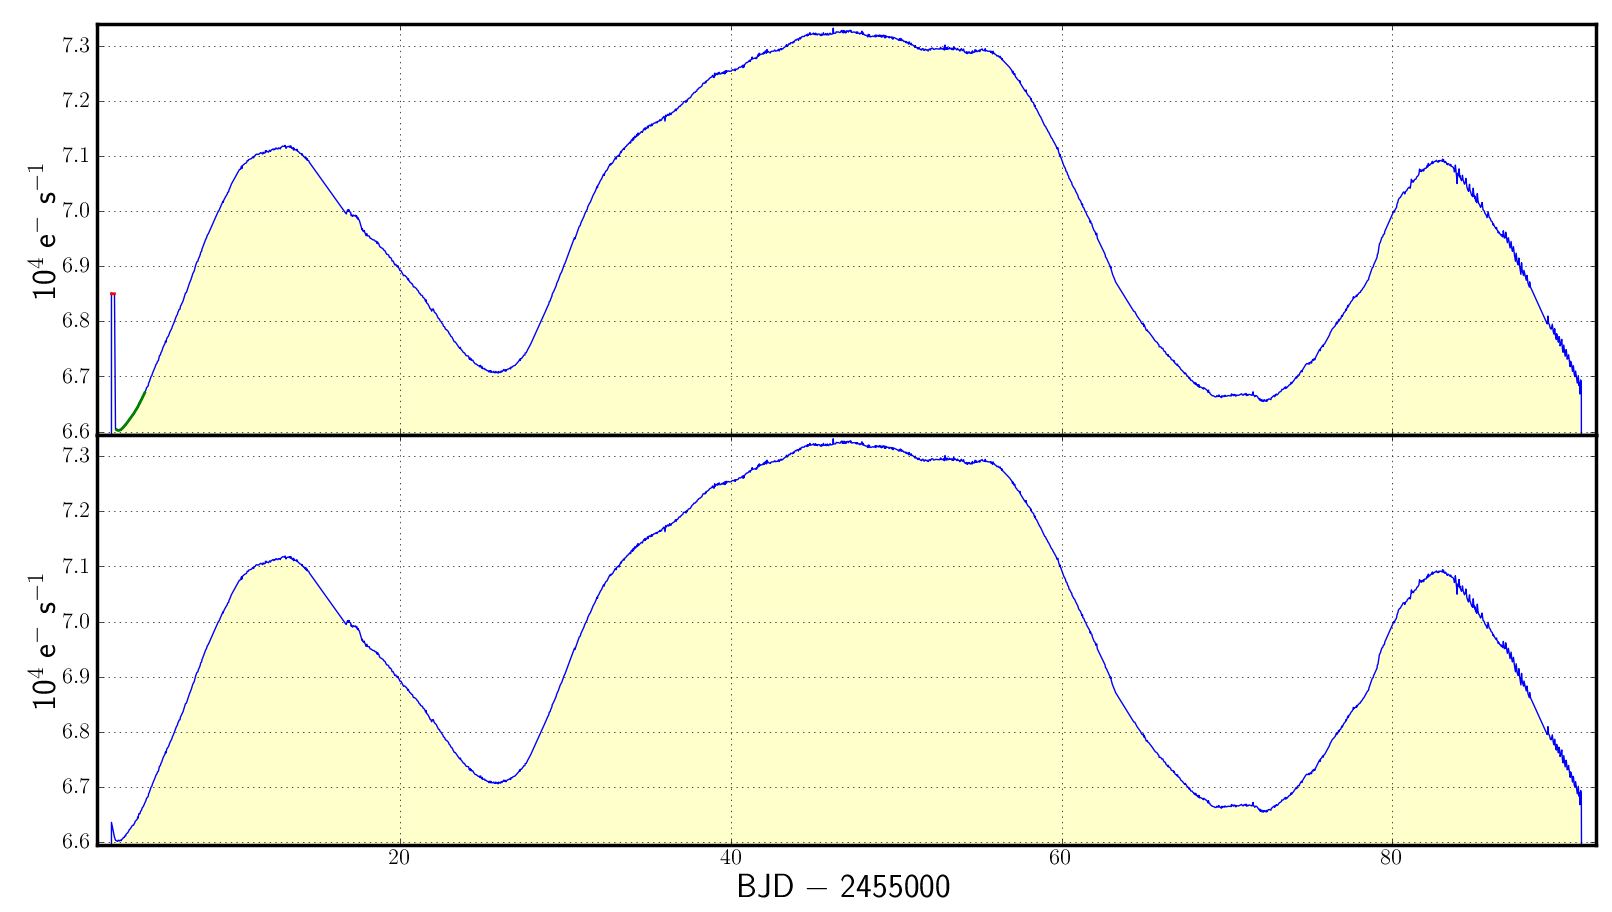
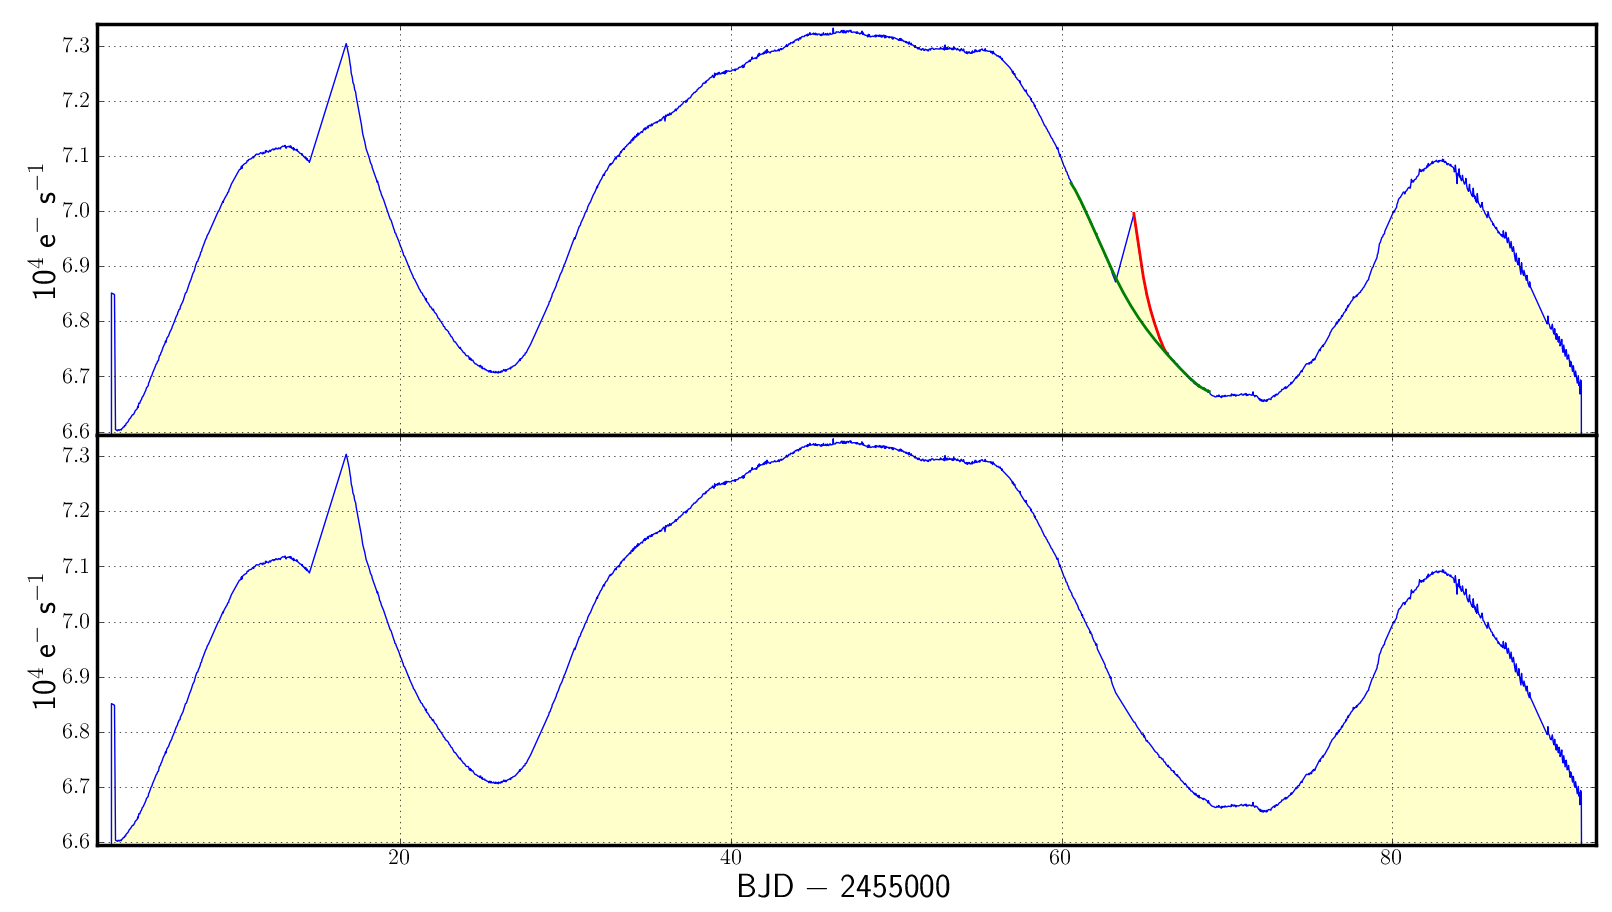
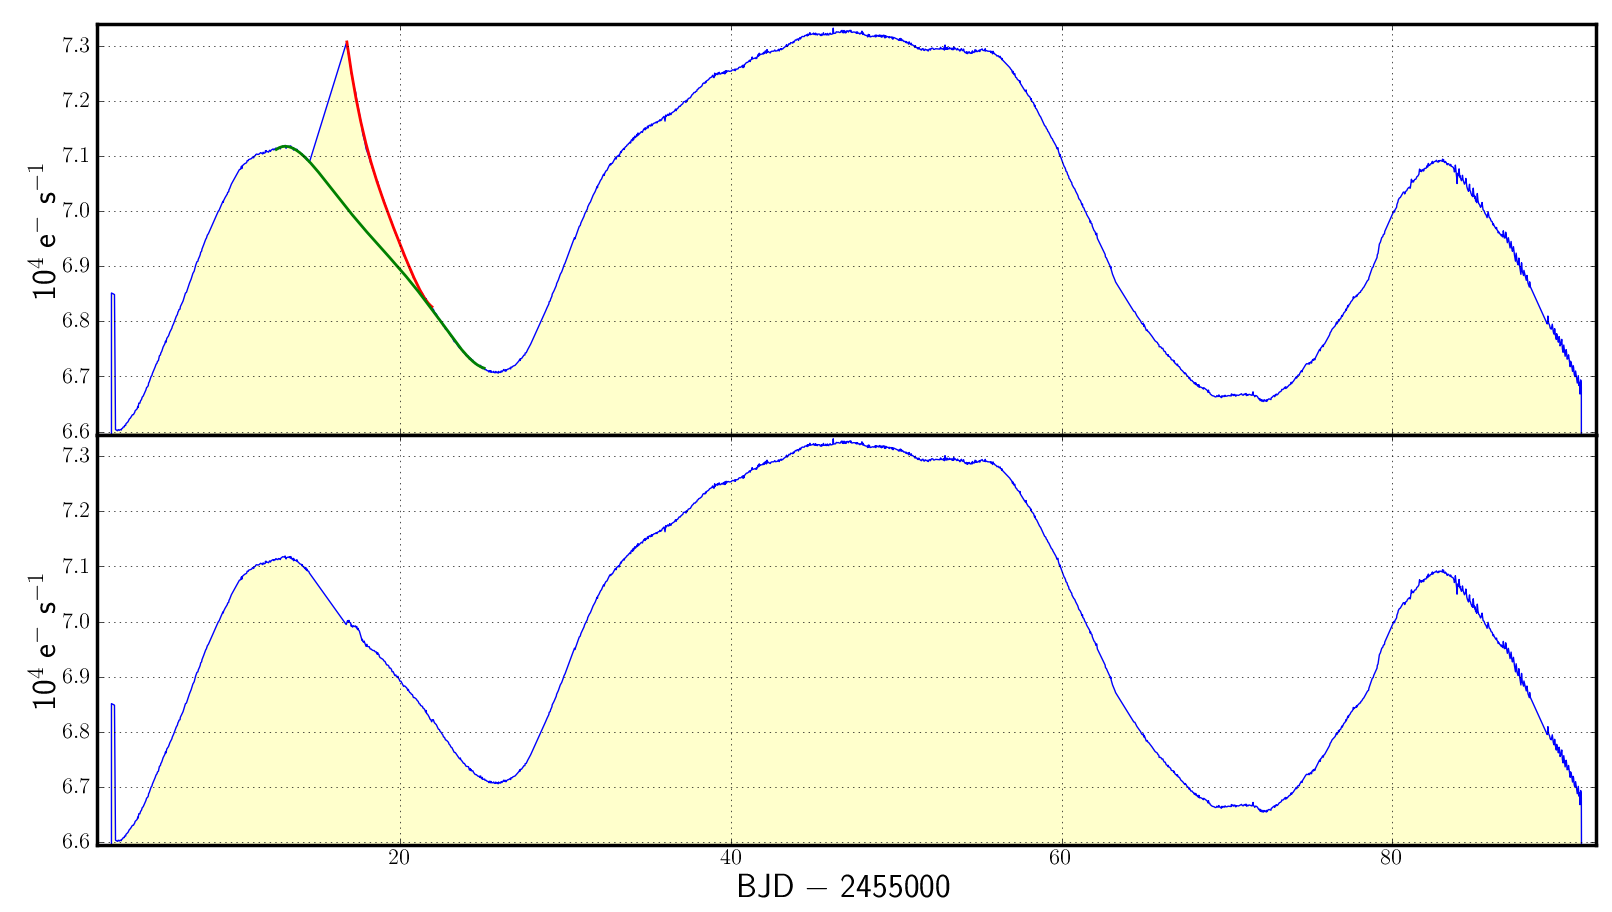
the other in the data range to be detrended. The examples plotted
below show the piecemeal correction of three systematic features
within a Q2 light curve. These three corrections are provided in the
task examples below.
EXAMPLE
- Detrend systematic #1:
- kepdetrend infile=kplr002436324-2009259160929_llc.fits
outfile=new1.fits datacol=SAP_FLUX errcol=SAP_FLUX_ERR
ranges1='2455063.59357,2455066.47292' npoly1=5 nsig1=3
niter1=10
ranges2='2455060.57026,2455063.59357;2455066.9768,2455068.99235'
npoly2=5 nsig2=3 niter2=10 popnans=n plot=y clobber=y
- Detrend systematic #2:
- kepdetrend infile=kplr002436324-2009259160929_llc.fits
outfile=new1.fits datacol=SAP_FLUX errcol=SAP_FLUX_ERR
ranges1='2455016.44428,2455021.91503' npoly1=5 nsig1=3
niter1=10
ranges2='2455012.48517,2455014.50072;2455022.63487,2455025.08231'
npoly2=5 nsig2=3 niter2=10 popnans=n plot=y clobber=y
- Detrend systematic #3:
- kepdetrend infile=kplr002436324-2009259160929_llc.fits
outfile=new1.fits datacol=SAP_FLUX errcol=SAP_FLUX_ERR
ranges1='2455002.51202,2455002.76169' npoly1=5 nsig1=3
niter1=10 ranges2='2455002.83936,2455004.56697'
npoly2=5 nsig2=3 niter2=10 popnans=n plot=y clobber=y

|
TIME REQUIREMENTS
Full completion upon one quarter of Kepler long cadence target using a 3.06
GHz Intel Core 2 Duo Mac running OS 10.6.4 takes a few seconds. Running times
increase by several factors if input data contains NaNs. These will be
filtered out before task execution.
BUGS AND LIMITATIONS
The Kepler PyRAF package is privately-developed software made available to
the community through the contributed software page of the GO program at
http://keplergo.arc.nasa.gov/ContributedSoftware.shtml. It is not an
official software product of the Kepler mission. Bugs and errors are not
the responsibility of NASA or the Kepler Team. Please send bug reports and
suggestions to keplergo@mail.arc.nasa.gov.
HISTORY
|
|
|
|
|
|
|
Initial software release (MS)
|
|
|
|
Updated for Kepler FITS v2.0 (MS)
|
|
|
|
Added option to keep any NaNs which are in the original data in the output FITS file. (TB)
|
|
|
|
Fixed minor bug when popnans is True. Error column now displays properly (TB)
|
|
|
|
Code can now be run from the command line (TB)
|
|
|
|
Fixed a bug where the data would not plot if there were NaNs
in the flux column (TB)
|
|
|
|
more reliable plot rendering on linux operating systems (MS)
|
SEE ALSO
kepcotrend, keprange
|


