|
NAME
kepdraw -- Interactive plotting of Kepler time series data
USAGE
kepdraw infile outfile datacol ploterr errcol quality lcolor
lwidth fcolor falpha labelsize ticksize xsize ysize fullrange
plotgrid verbose logfile status
PARAMETERS
infile = string
The name of a MAST standard format FITS file containing a Kepler light curve
within the first data extension.
outfile = string
The name of the output PNG plot file.
datacol = string
The FITS column within extension 1 of infile to be
plotted against time.
ploterr = boolean
Plot error bars with the data?
errcol = string
The uncertainty data coupled to datacol. If
ploterr=yes then these data will be plotted as error bars
quality = boolean
Ignore bad data and cadence gaps in datacol?
lcolor = string
The color of the line plot. These can be chosen in html
notation, e.g. black is #000000 and white is #ffffff. The html
color scheme can be browsed in multiple online charts.
lwidth = float
The width of the plot line in arbitrary units. The plotting default width
is 1.0.
fcolor = string
The color of the fill under the plot line. These can be chosen in html
notation, e.g. black is #000000 and white is #ffffff. The html
color scheme can be browsed in multiple online charts.
falpha = float
The transparency of the fill color. 0.0 is transparent, 1.0 is opaque.
labelsize = float
The font size of the plot labels.
ticksize = float
The axes tick sizes within the plot.
xsize = float
The length of the plotting window in arbitrary units. A typical
value is 16.0
ysize = float
The height of the plotting window in arbitrary units. A typical
value is 8.0
fullrange = boolean (optional)
Plot the flux range between zero and the maximum and 101% of
the flux maximum? Otherwise plot the range 99% of the flux
minimum to 101% of the flux maximum.
plotgrid = boolean (optional)
Plot a grid over the data on the major tick marks?
verbose = boolean (optional)
Print informative messages and warnings to the shell and logfile?
logfile = string (optional)
Name of the logfile containing error and warning messages.
status = integer
Exit status of the script. It will be non-zero if the task halted with an
error. This parameter is set by the task and should not be modified by the
user.
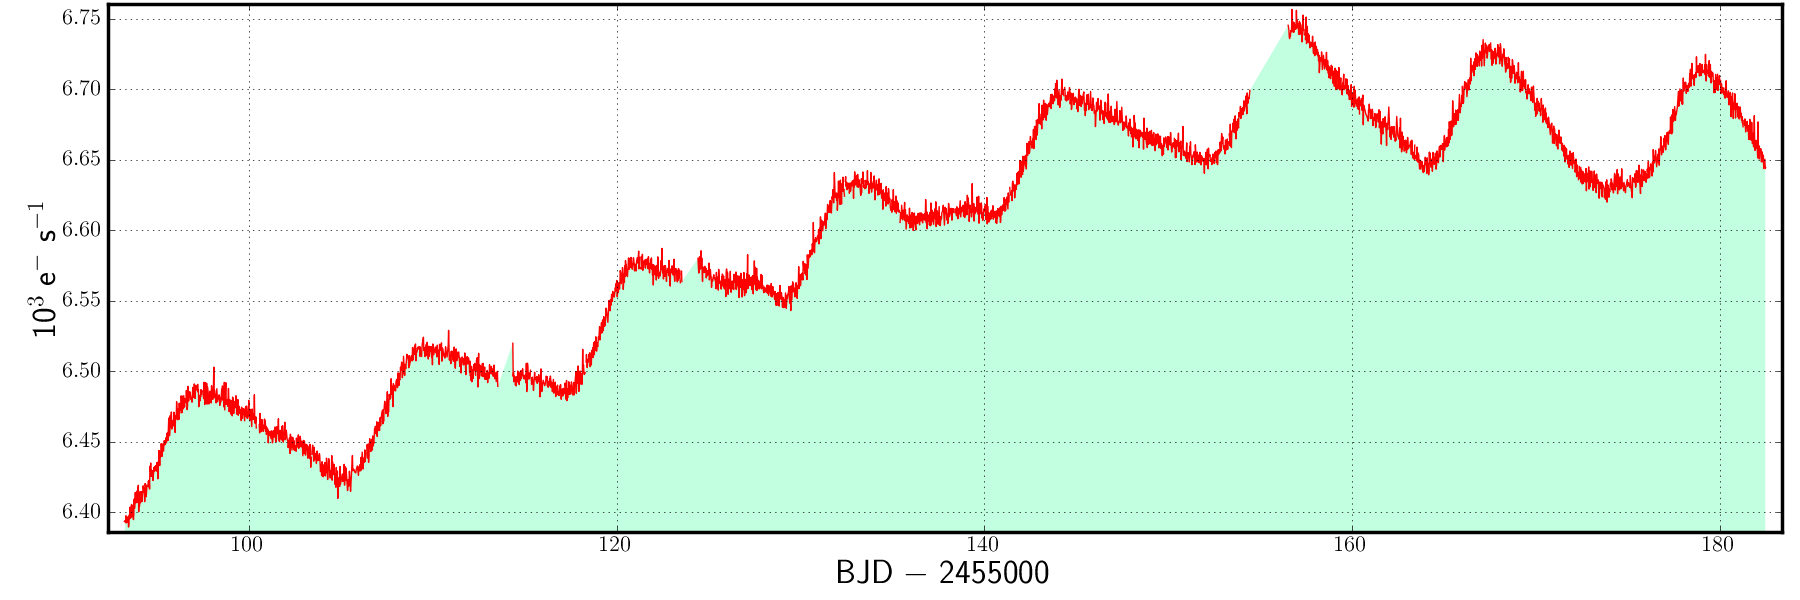
DESCRIPTION
kepdraw plots a chosen data column within a FITS light curve
over time. The standard functionality within the matplotlib
plotting library allows the user to zoom and pan before saving
to a file.
EXAMPLE
- kepdraw infile=kplr002436324-2009259160929_llc.fits
outfile=kplr002436324-2009259160929_llc.png
datacol=SAP_FLUX ploterr=n errcol=SAP_FLUX_ERR quality=y
lcolor='#0000ff'
lwidth=1.0 fcolor='#ffff00' falpha=0.2 labelsize=24 ticksize=16
xsize=18 ysize=6 fullrange=n plotgrid=y verbose=y
TIME REQUIREMENTS
Full completion upon one quarter of Kepler long cadence target using a 3.06
GHz Intel Core 2 Duo Mac running OS 10.6.4 takes a few seconds. Running times
increase by several factors if input data contains NaNs. These will be
filtered out before task execution.
BUGS AND LIMITATIONS
The Kepler PyRAF package is privately-developed software made available to
the community through the contributed software page of the GO program at
http://keplergo.arc.nasa.gov/ContributedSoftware.shtml. It is not an
official software product of the Kepler mission. Bugs and errors are not
the responsibility of NASA or the Kepler Team. Please send bug reports and
suggestions to keplergo@mail.arc.nasa.gov.
HISTORY
|
|
|
|
|
|
|
Initial software release (MS)
|
|
|
|
The error is captured when quality=no but no SAP_QUALITY column occurs within the input FITS file. This situation can occur with data delivered to the MAST before Jun 2011 (MS)
|
|
|
|
Updated for Kepler FITS v2.0 (MS)
|
|
|
|
Fixed bug that prevented user from modifying tick font size (MS)
|
|
|
|
The axes can now be re-sized using the menu accessible from the plotting window (TB)
|
|
|
|
Y-axis label name is adjustable (MS)
|
|
|
|
Code can now be run from the command line (TB)
|
|
|
|
more reliable plot rendering on linux operating systems (MS)
|
|
