|
|
|
||

| |||
| PyKE Primer - 7. Walk-through Examples B. MITIGATE MOTION AND FOCUS ARTIFACTS BY REDEFINING THE OPTIMAL APERTURE | |||
|
Step 1: Plot archived SAP data In this example we consider the quarter 2 data for KIC 8703536. As with the majority of Kepler targets, the flux from KIC 8703536 is under-captured and systematic artifacts dominate certain frequencies within the SAP time-series. This target provides a conspicuous example because the source is spatially extended. The archived pixel mask and aperture were constructed unaware of this fact. Furthermore, the KIC indicates that the target lies close to several fainter stellar sources that might be contaminants to the archived light curve. The archived SAP light curve for KIC 8703536 is displayed in Figure B1. This plot can be recreated using the PyKE task kepdraw. 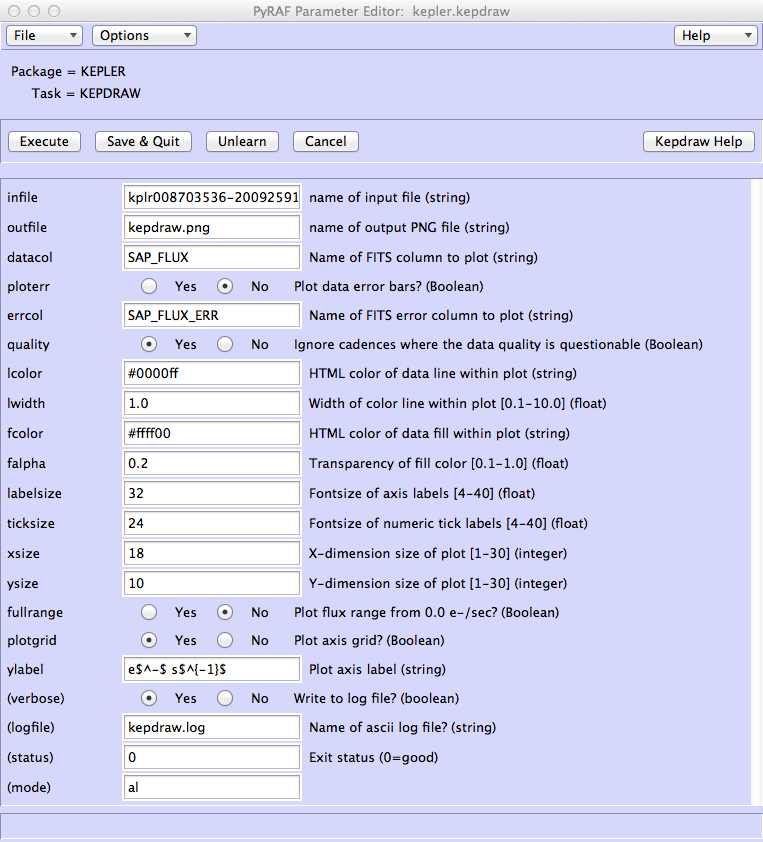
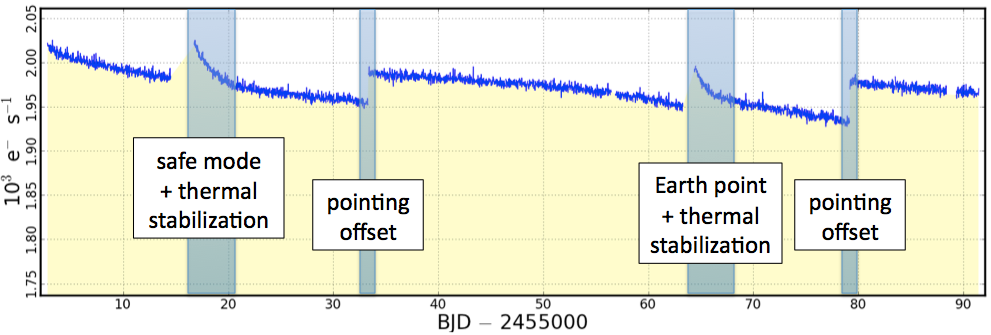
Figure B1: The archived quarter 2 SAP light curve of KIC 8703536. As well as the long term DVA trend across the whole quarter, intervals shaded blue identify generic quarter 2 events that add conspicuous systematic noise to the light curve. Artifact nature is labeled within the white boxes. The delivered command is asking that the SAP_FLUX column in the archived FITS file kplr008703536-2009259160929_llc.fits be plotted to a new file called kepdraw.png. Plotting of the 1-σ error bars from the SAP_FLUX_ERR column is suppressed, and timestamps with non-zero quality flags will be ignored. Additional parameters control the look and feel of the plot – e.g. colors, line widths, fonts, etc. Systematic structure is apparent in the form of DVA, commanded spacecraft pointing corrections and thermal trends following monthly data downloads. The target is the Seyfert 2 galaxy 2MASX J19471938+4449425 and it is expected to be relatively quiet intrinsically in the Kepler bandpass at high frequencies. Nevertheless, the SAP light curve displays four features that we can identify as systematic in nature because they coincide with spacecraft events and occur within all Kepler target light curves at the same time to a lesser or greater degree. These occur after a spacecraft safe mode, a pointing to Earth for data transfer, and two spacecraft attitude tweaks. Each systematic event can be identified by referencing the data quality flags supplied within the light curve file and TPF. Step 2: Plot archived photometric time-series for individual target pixels The photometric aperture that yielded the light curve in Figure B1, the target pixel mask and the individual pixel photometry are provided in Figure B2. This image can be replicated using the PyKE task keppixseries on the quarter 2 TPF kplr008703536-2009259160929_lpd-targ.fits: 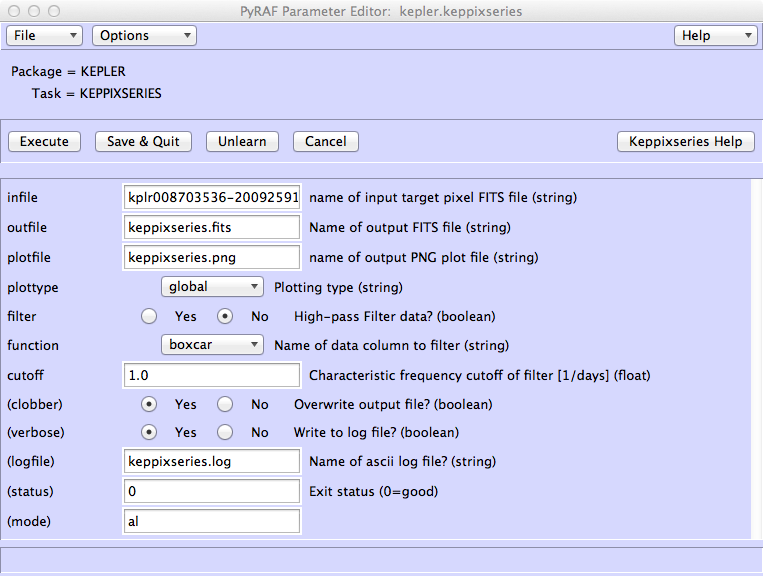
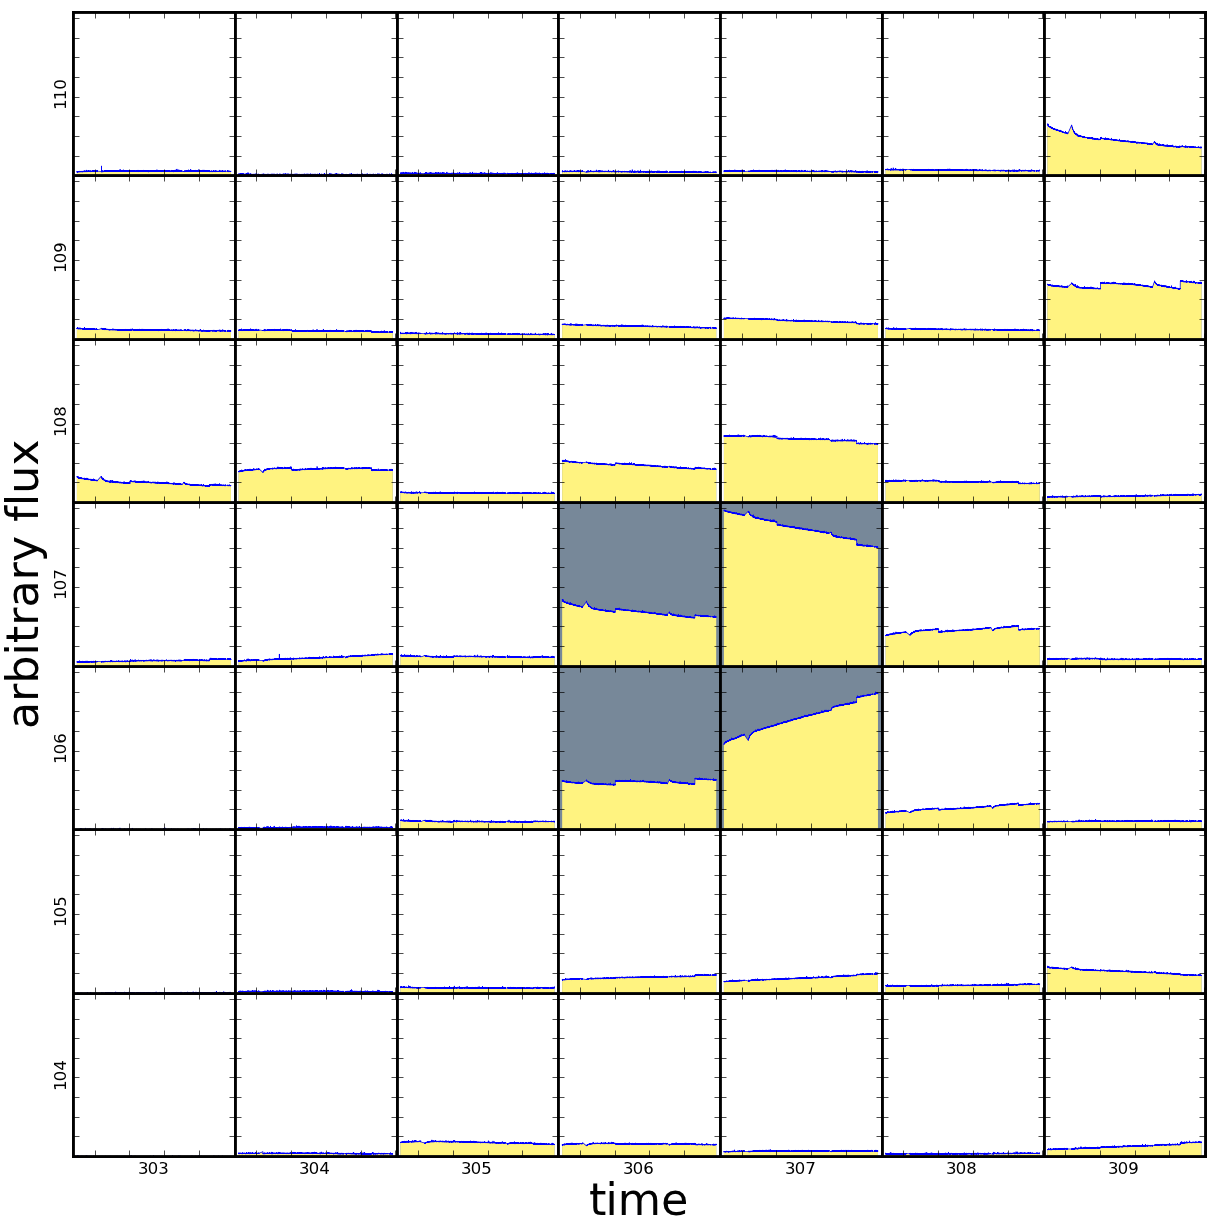
Figure B2: Calibrated time-series photometry for every pixel within the mask surrounding the quarter 2 target KIC 8703536. Each light curve is plotted on the same flux scale. Source confusion between more than one object within the mask is evident. Grey pixels define the optimal aperture employed to calculate the SAP light curve in Figure B1. Two new files will be created – keppixseries.fits contains the tabulated data for each individual pixel light curve, and keppixseries.png contains the requested plot. The parameter plot type=global requests that all light curves are plotted on the same photometric scale and the data plotted are not bandpass filtered - filtering would e.g. reduce the low frequency effects of differential velocity aberration. Step 3: Define new optimal apertures to mitigate motion and focus artifacts Our task is to reduce systematic motion and focus artifacts by extracting a light curve from a new strategically-chosen pixel aperture. Figure B3 contains the pixel image from one specific timestamp in the Quarter 2 Target Pixel File of KIC 8703536. The green, transparent pixels represent a new custom photometric aperture defined using the PyKE task kepmask. An interactive image is called with the command: 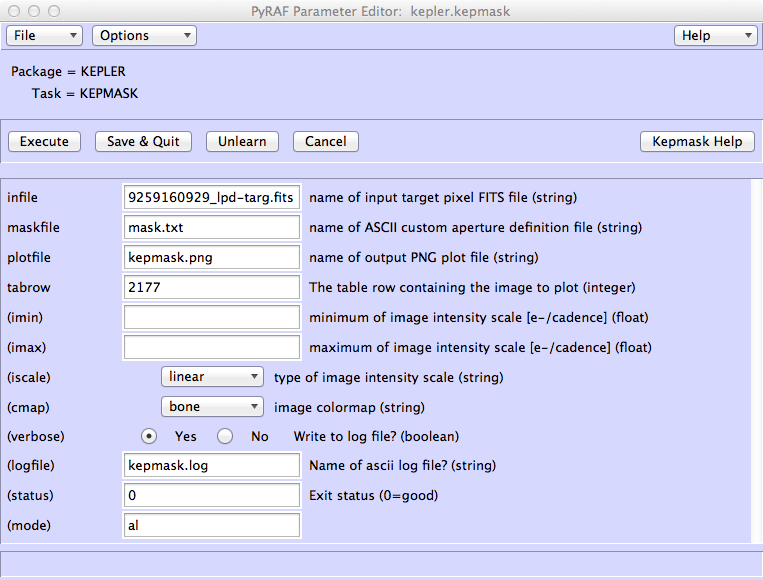
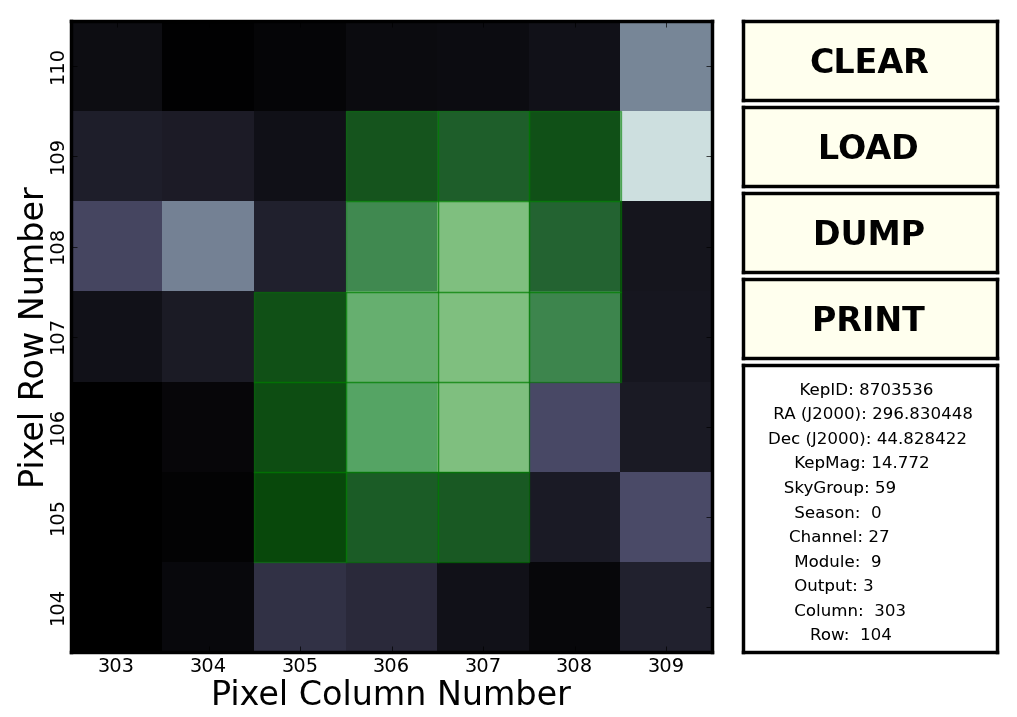
Figure B3: A manually-constructed aperture is defined by the green pixels, overlaid upon one specific postage stamp image (the 2,177th timestamp) contained within the archived Target Pixel File. The new aperture yields the light curve provided in Figure B4. This figure was produced with PyKE task kepmask, which allow the user to select manually sets of pixels from which to construct a new optimal aperture. The image associated with the 2,177th timestamp in the Target Pixel File is plotted on a linear intensity scale using the bone color lookup table. The new aperture is stored for future use within a file called mask.txt. Users of the kepmask tool define a new aperture interactively by moving their mouse over a pixel. One press of the ’X’ keyboard key selects a pixel for inclusion within the new aperture, a second press deselects the pixel. The aperture is written to file by clicking the ’DUMP’ button on the interactive GUI. Step 4: Extract SAP light curve from new optimal pixel aperture The task kepextract is employed to sum the pixels without weights within the newly defined aperture and produce a new light curve FITS file called kepextract.fits: 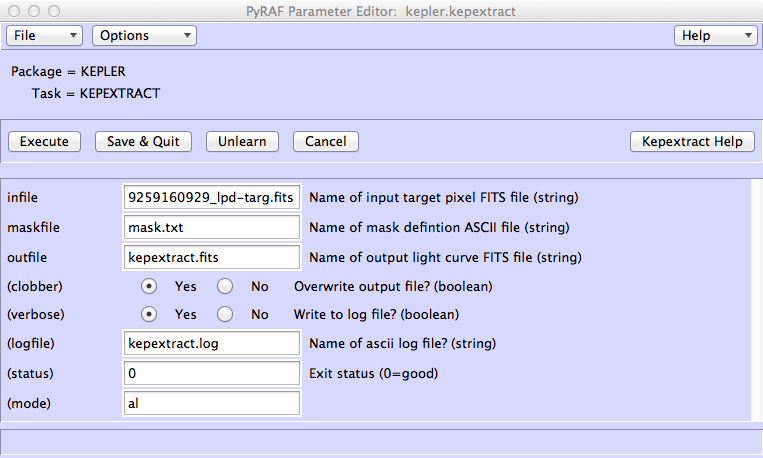
Step 5: Plot SAP light curve extracted from new optimal aperture The light curve in the lower panel of Figure B4 is the target data re-extracted from the newly defined aperture. As before in step 1, the light curve is rendered using kepdraw: 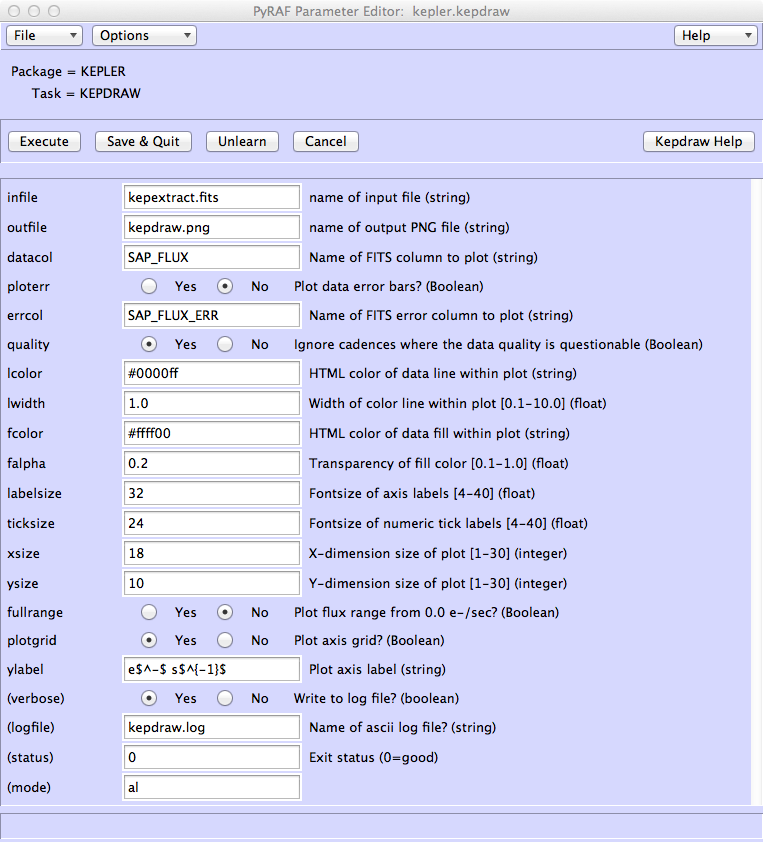
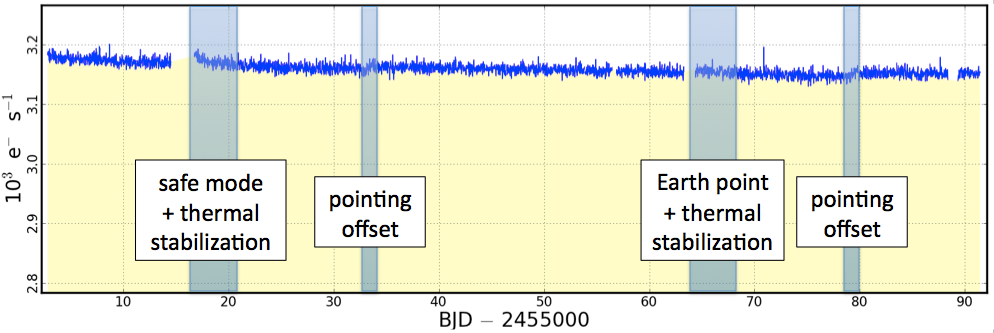
Figure B4: A light curve of KIC 8703536, extracted from the quarter 3 TPF. Motion- and focus-related artifacts have been reduced with the choice of a larger optimal aperture. While there remains some high frequency structure associated with the safe mode and potentially some residual low frequency noise related to differential velocity aberration, systematic artifacts are much reduced with the new aperture. Either the extended target is still not fully captured or we have introduced new systematic noise with the inclusion of new source contaminants. Optimizing the light curve further with additional aperture iterations is left as an exercise for the user. |
Up: PyKE Walk-through Examples
Questions concerning Kepler's science opportunities and open programs, public archive or community tools? Contact us via the email address.