|
NAME
kepflatten -- Remove low frequency variability from time-series, preserve transits and flares
USAGE
kepflatten infile outfile datacol nsig stepsize npoly niter operation ranges
plot plotfit clobber verbose logfile
PARAMETERS
infile = string
The name of a MAST standard format FITS file containing a Kepler light curve
within the first data extension.
outfile = string
The name of the output FITS file. outfile will be a direct copy of
infile but with NaN timestamps removed and two new columns in the 1st extension - DETSAP_FLUX (a flattended or detrended for low-frequency variations version of the data) and DETSAP_FLUX_ERR (the asscoaited 1-σ error).
datacol = string
The column name containing data stored within extension 1 of infile.
This data will be searched for outliers. Typically this name is
SAP_FLUX (Simple Aperture Photometry fluxes), PDCSAP_FLUX
(Pre-search Data Conditioning fluxes) or CBVSAP_FLUX (SAP_FLUX corrected for systematic artifacts by the PyKE tool kepcotrend).
errcol = string
The column name containing photometric 1-σ errors stored within extension 1 of infile.
Typically this name is
SAP_FLUX_ERR (Simple Aperture Photometry fluxes), PDCSAP_FLUX_ERR
(Pre-search Data Conditioning fluxes). The error column coupled to CBVSAP_FLUX data is SAP_FLUX_ERR. kepflatten normalizes datacol and errcol consistently using a series of best fit polynomials.
nsig = float
The sigma clipping threshold in units of σ. Data deviating from a best fit function by
more than the threshold will ignored during subsequent fit iterations.
stepsize = float
The data within datacol is unlikely to be well represented by a single
polynomial function. stepsize splits the data up into a series of time
blocks, each is fit independently by a separate function. The user can provide
an informed choice of stepsize after inspecting the data with the
kepdraw tool. Units are days.
npoly = integer
The order of each piecemeal polynomial function.
niter = integer
If outliers outside of nsig are found in a particular data section, that data will be removed
temporarily and the time series fit again. This will be iterated niter
times before freezing upon the best current fit.
ranges = string
The user can choose specific time ranges of data on which to work. This could,
for example, avoid removing known stellar flares from a dataset. Ranges can
be supplied using one of two methods.
- Time ranges are supplied as comma-separated pairs of Barycentric Julian
Dates (BJDs). Multiple ranges are separated by a semi-colon. An example
containing two time ranges is:
'2455012.48517,2455014.50072;2455022.63487,2455025.08231'.
If the user wants to correct the entire time series then providing
ranges = '0,0' will tell the task to operate on the whole time
series.
- The user can provide time ranges within a pre-prepared ascii file containing
one time range per line, e.g.:
2455012.48517,2455014.50072
2455022.63487,2455025.08231
etc
The file 'arbitraryname.txt' is provided to the task using ranges =
@arbitraryname.txt, where the '@' tells the task that a file is being provided.
Files containing time ranges can be generated manually or with the aid of
data inspection using the task keprange.
plot = boolean
Plot the data, fit, outliers and result?
clobber = boolean (optional)
Overwrite the output file? if clobber = no and an existing file has
the same name as outfile then the task will stop with an error.
verbose = boolean (optional)
Print informative messages and warnings to the shell and logfile?
logfile = string (optional)
Name of the logfile containing error and warning messages.
status = integer
Exit status of the script. It will be non-zero if the task halted with an
error. This parameter is set by the task and should not be modified by the
user.
DESCRIPTION
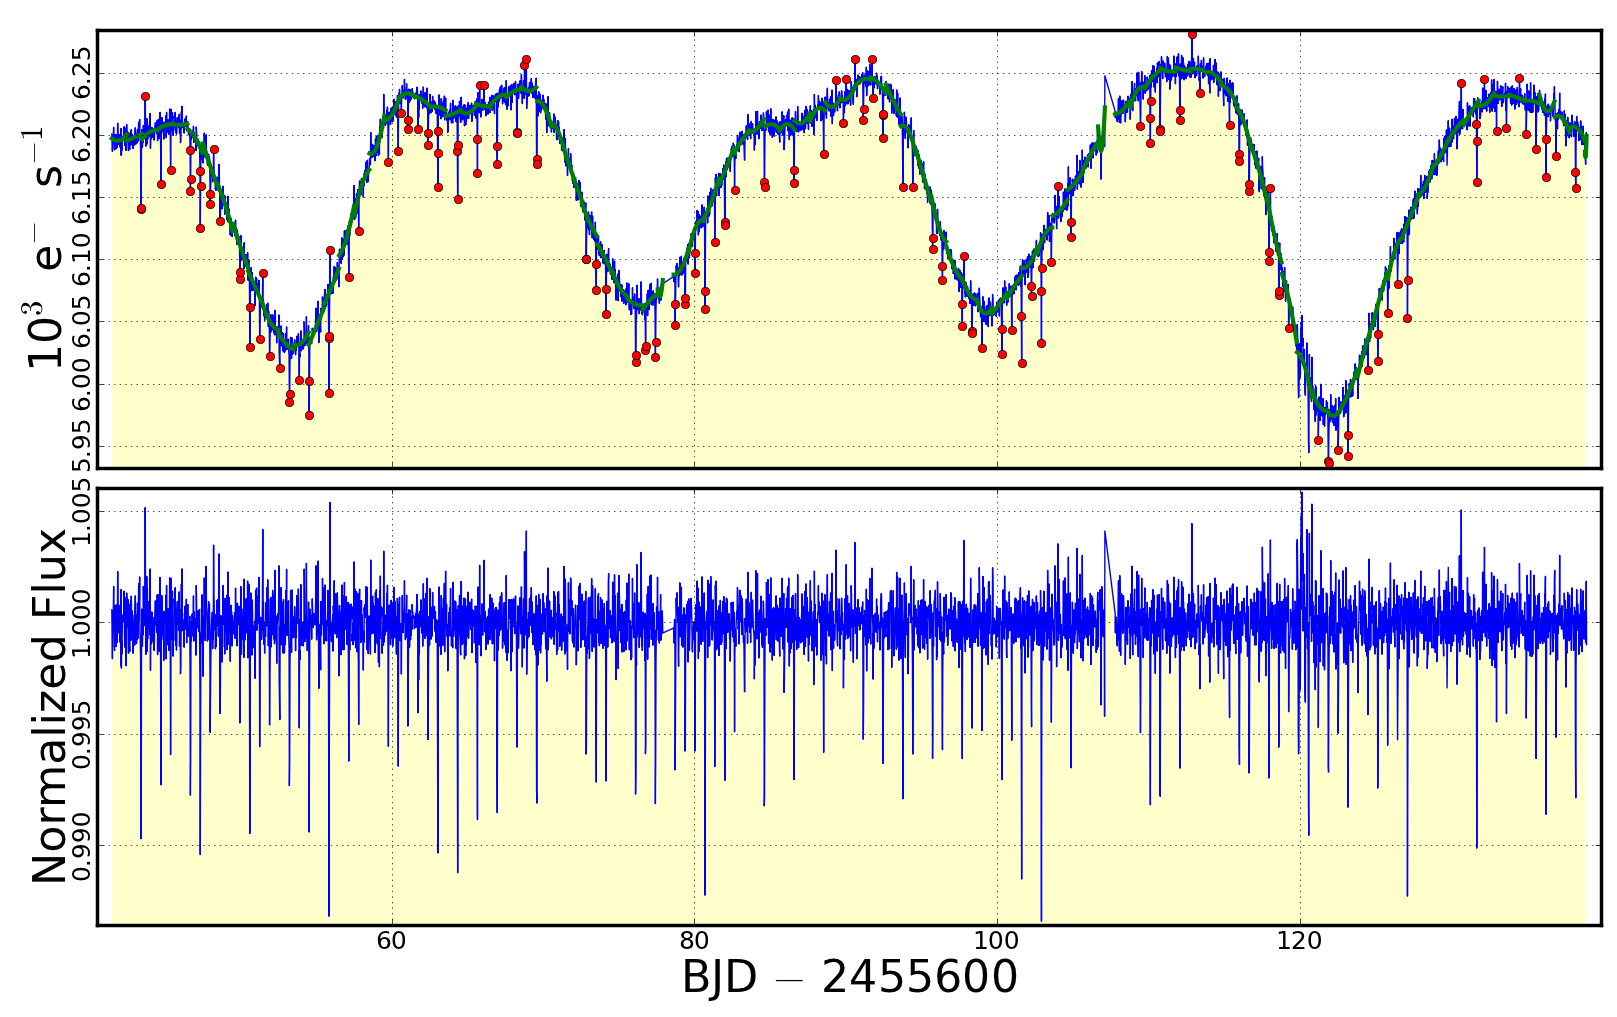
kepflatten detrends data for low-frequency photometric structure by dividing by best-fit piecemeal polynomials over a sequential series of small time ranges across the data. Outliers are iteratively-clipped from the fit, therefore structure in e.g. short-lived transits or flares are better preserved compared to e.g. bandpass filtering methods (kepfilter). Optionally, input data, best fits, fit outliers and output data are rendered to a plot window. In many respects kepflatten performs the opposite task to kepoutlier which removes statistical outliers while preserving low-frequency structure in light curves.
EXAMPLE
- Remove steller rotation structure from a PDCSAP time-series:
- kepflatten infile=kplr012557548-2011177032512_llc.fits
outfile=kepflatten.fits datacol=PDCSAP_FLUX errcol=PDCSAP_FLUX_ERR nsig=3 stepsize=1.0 npoly=2
niter=10 plot=y
TIME REQUIREMENTS
Full completion upon one quarter of Kepler long cadence target using a 3.06
GHz Intel Core 2 Duo Mac running OS 10.6.4 takes a few seconds. Running times
increase by several factors if input data contains NaNs. These will be
filtered out before task execution.
BUGS AND LIMITATIONS
kepflatten cuerrently employs piecemeal polynomial fitting to remove low frequnecy signal from data. A sliding-piecemeal polynomial, stepped across individual timestamps would provide a smoother result. The Kepler PyRAF package is privately-developed software made available to
the community through the contributed software page of the GO program at
http://keplergo.arc.nasa.gov/ContributedSoftware.shtml. It is not an
official software product of the Kepler mission. Bugs and errors are not
the responsibility of NASA or the Kepler Team. Please send bug reports and
suggestions to keplergo@mail.arc.nasa.gov.
HISTORY
|
|
|
|
|
|
|
Initial software release (MS)
|
SEE ALSO
kepoutlier, keprange, kepdetrend, kepfilter, kepstitch
|

