|
NAME
kepfilter -- bandpass filtering of Kepler light curve data
USAGE
kepfilter infile outfile datacol function cutoff passband plot plotlab clobber verbose logfile status
PARAMETERS
infile = string
The name of a
MAST standard format FITS file containing Kepler light curve data within the first data extension.
outfile = string
The name of the output FITS file. The output file is identical in format to the input file. The data to be filtered will be overwritten in the output file by its filtered version.
datacol = string
The name of the data column in the input FITS file to be filtered, e.g. SAP_FLUX, PDCSAP_FLUX, MOM_CENTR1 etc. A full list of archived data columns is provided in the Kepler Archive Manual.
function = string
The functional form of the bandpass convolution function. The Options:
boxcar | gauss | sinc
cutoff = float
The frequency of the bandpass cutoff in units of days-1.
passband = string
The type of filter to be applied. A low bandpass filter will suppress high-frequency signal shorter than the cutoff. A high bandpass filter will suppress low-frequency signal longer than the cutoff. The Options:
low | high
plot = boolean
Plot the original light curve and the result of the filter?
plotlab = string
vertical axis label for plot
clobber = boolean (optional)
Overwrite the output file? if clobber = no and an existing file has
the same name as outfile then the task will stop with an error.
verbose = boolean (optional)
Print informative messages and warnings to the shell and logfile?
logfile = string (optional)
Name of the logfile containing error and warning messages.
status = integer
Exit status of the script. It will be non-zero if the task halted with an
error. This parameter is set by the task and should not be modified by the
user.
DESCRIPTION
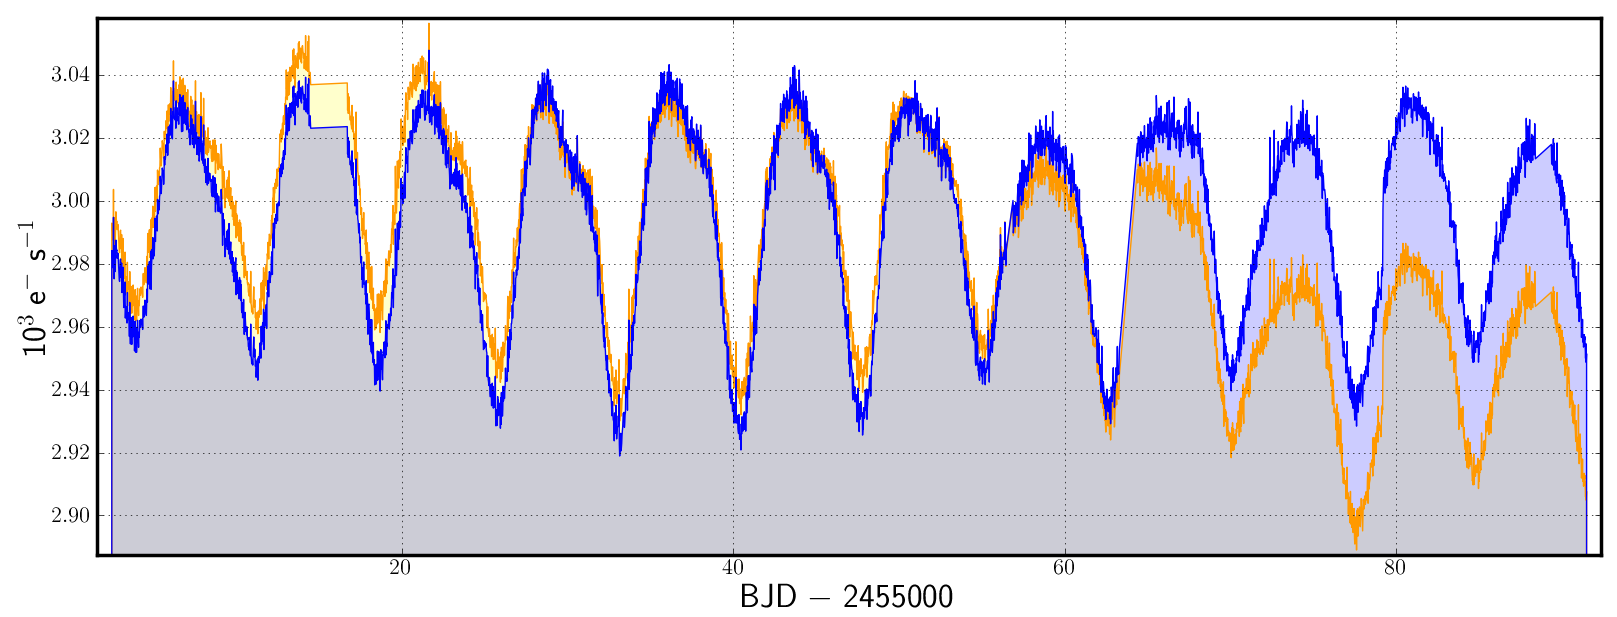
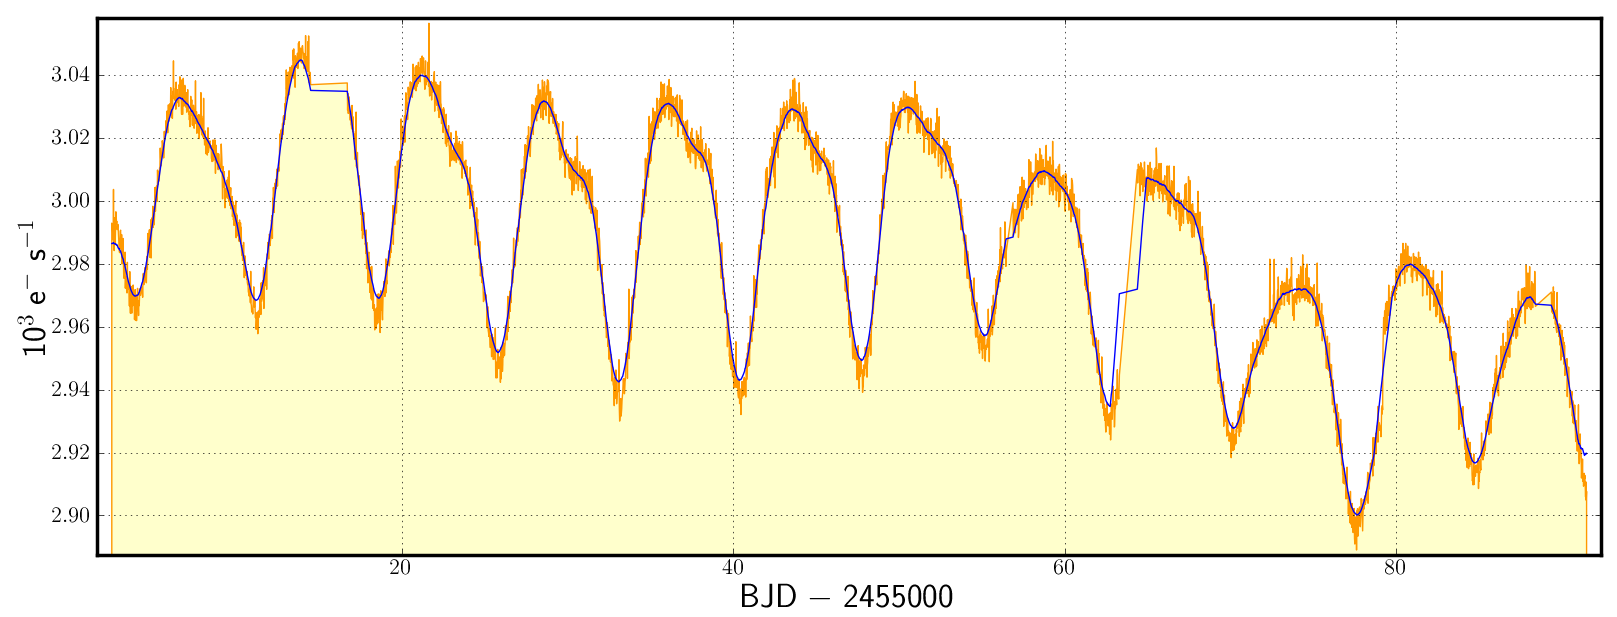
kepfilter applies a bandpass filter to Kepler light curve data. In the low bandpass option, the data is convolved with a function of user-specified width. Choices of convolution function are boxcar, Gaussian or sinc. In the high bandpass option the convolution minus the median of the convolution is subtracted from the original data. The filtered data is copied to a new FITS file with the same structure as the input file.
EXAMPLES
- kepfilter infile=kplr004936533-2009259160929_llc.fits outfile=kplr004936533-2009259160929-lo.fits datacol=SAP_FLUX function=boxcar cutoff=0.1 passband=lo plot=y plotlab='e$^-$ s$^{-1}$' clobber=yes
- kepfilter infile=kplr004936533-2009259160929_llc.fits outfile=kplr004936533-2009259160929-hi.fits datacol=SAP_FLUX function=sinc cutoff=1.0 passband=hi plot=y plotlab='e$^-$ s$^{-1}$' clobber=yes
TIME REQUIREMENTS
Completion upon one target pixel file using a 2.66
GHz Intel Core 2 i7 Mac running OS 10.6.7, takes a few seconds
in addition to the manual input required by the tool.
BUGS AND LIMITATIONS
Statistical uncertainties are not propagated through the bandpass filter. The Kepler PyRAF package is privately-developed software made available to
the community through the contributed software page of the Kepler astrophysics program at
http://keplergo.arc.nasa.gov/ContributedSoftware.shtml. It is not an
official software product of the Kepler mission or NASA. Bugs and errors are not
the responsibility of the Kepler Team or NASA. Please send bug reports and
suggestions to keplergo@mail.arc.nasa.gov.
HISTORY
|
|
|
|
|
|
|
Initial software release (MS)
|
|
|
|
Updated for Kepler FITS v2.0 (MS)
|
|
|
|
Code can now be run from the command line (TB)
|
|
|
|
more reliable plot rendering on linux operating systems (MS)
|
SEE ALSO
kepflatten, kepdetrend
|


