|
NAME
kepdiffim -- difference imaging of pixels within a target mask
USAGE
kepdiffim infile outfile plotfile imscale colmap filter function cutoff clobber verbose logfile status
PARAMETERS
infile = string
The name of a
MAST standard format FITS file containing Kepler Target Pixel data within the first data extension.
outfile = string
The name of the output FITS file. This file has four data extensions. The first called 'FLUX' contains an image of the pixel-by-pixel mean flux within target mask. The second contains the pixel variance image of the mask pixels over time. The third contains the standard deviation image, in this case the variance image is normalized to the median 1-σ error for each pixel. The fourth extension is the pixel mask, as defined in the second extension of the target pixel file.
plotfile = string
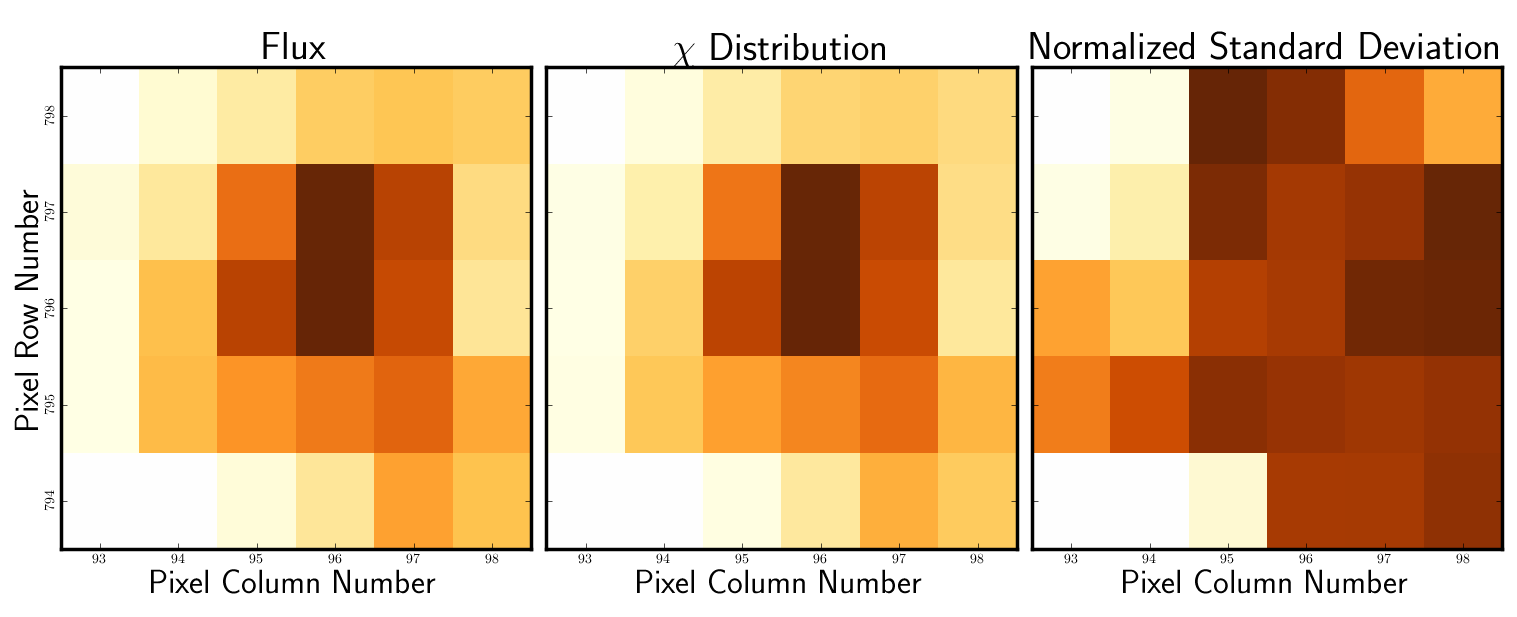
Name of an optional diagnostic output plot file containing the results of kepdiffim. An example is provided in Figure 1. Typically this is a PNG format file. If no diagnostic file is required, plotfile can be 'None'. If plotfile='None' the plot will be generated but the plot will not be saved to a file.
imscale = String
kepdiffim can plot images with three choices of image scales. The choice is made using this argument. The Options are: linear | logarithmic |squareroot
cmap = string (optional)
Color intensity scheme for the image display. The various options can be inspected and
compared together if cmap=browse is selected. Options:
Accent | Blues | BrBG | BuGn | BuPu | Dark2 | GnBu | Greens | Greys | OrRd | Oranges | PRGn | Paired | Pastel1 | Pastel2 | PiYG | PuBu | PuBuGn | PuOr | PuRd | Purples | RdBu | RdGy | RdPu | RdYlBu | RdYlGn | Reds | Set1 | Set2 | Set3 | Spectral | YlGn | YlGnBu | YlOrBr | YlOrRd | afmhot | autumn | binary | bone | brg | bwr | cool | copper | flag | gist_earth | gist_gray | gist_heat | gist_ncar | gist_rainbow | gist_yarg | gnuplot | gnuplot2 | gray | hot | hsv | jet | ocean | pink | prism | rainbow | seismic | spectral | spring | summer | terrain | winter | browse.
If cmap=browse kepdiffim will plot the choices of color map.
filter = boolean
If filter=yes, the light curve for each pixel will be treated by a high band-pass filter to remove long-term trends from e.g. differential velocity aberration.
function = string
The functional form of the high pass-band filter. The Options:
boxcar | gauss | sinc
cutoff = float
The frequency of the high pass-band cutoff in units of days-1.
clobber = boolean (optional)
Overwrite the output file? if clobber = no and an existing file has
the same name as outfile then the task will stop with an error.
verbose = boolean (optional)
Print informative messages and warnings to the shell and logfile?
logfile = string (optional)
Name of the logfile containing error and warning messages.
status = integer
Exit status of the script. It will be non-zero if the task halted with an
error. This parameter is set by the task and should not be modified by the
user.
DESCRIPTION
kepdiffim plots the mean, standard deviation and χ distribution images for the mask contained within a target pixel file. The standard deviation on each pixel is defined as [mean - flux]2 / [N - 1]. The χ distribution is sqrt({[mean - flux] / σ}2). If required, the data can be fed through a boxcar, gaussian or sinc function high bandpass filter in order to remove low frequency signal from the data. kepdiffim is a diagnostic tool for identifying source contaminants in the background or foreground of the target. It can be employed to identify pixels for inclusion or exclusion when re-extracting a Kepler light curve from target pixel files.
EXAMPLE
- kepdiffim infile=kplr011390659-2010355172524_lpd-targ.fits outfile=kepdiffim.fits plotfile=kepdiffim.png imscale=lin colmap=YlOrBr filter=yes function=boxcar cutoff=0.1 clobber=yes
TIME REQUIREMENTS
Completion upon one target pixel file using a 2.66
GHz Intel Core 2 i7 Mac running OS 10.6.7, takes a few seconds
in addition to the manual input required by the tool.
BUGS AND LIMITATIONS
The Kepler PyRAF package is privately-developed software made available to
the community through the contributed software page of the Kepler astrophysics program at
http://keplergo.arc.nasa.gov/ContributedSoftware.shtml. It is not an
official software product of the Kepler mission or NASA. Bugs and errors are not
the responsibility of the Kepler Team or NASA. Please send bug reports and
suggestions to keplergo@mail.arc.nasa.gov.
HISTORY
|
|
|
|
|
|
|
Initial software release (MS)
|
|
|
|
Trapped error where time=NaN is not flagged in the quality column (MS)
|
|
|
|
Trapped error where time=NaN is not flagged in the quality column (MS)
|
|
|
|
Trapped new behavior of STSCI_PYTHON 2.12 in reading multi-dimension FITS columns (MS)
|
|
|
|
Code can now be run from the command line (TB)
|
|
|
|
more reliable plot rendering on linux operating systems (MS)
|
SEE ALSO
kepmask, kepextract, keppixseries
|


