|
NAME
keptrial -- Calculate best period and error estimate from time series
USAGE
keptrial infile outfile datacol errcol fmin fmax nfreq method
ntrials plot clobber verbose logfile status
PARAMETERS
infile = string
The name of a
MAST standard format FITS file containing a Kepler light curve
within the first data extension.
outfile = string
The name of the output FITS file with a new extension containing
the results of a Monte Carlo period analysis.
datacol = string
The column name containing data stored within extension 1 of infile.
This data is the input data for a series of Fourier transform
calculations. Typically this name is
SAP_FLUX (Simple Aperture Photometry fluxes), but any
data column within extension 1 of the FITS file can be used
provided it is coupled to an error column name using errcol.
errcol = string
The uncertainty data coupled to datacol. Typically this
column is called SAP_FLUX_ERR.
fmin = float
The minimum frequency on which each power spectrum will be
calculated. The unit is 1/day.
fmax = float
The maximum frequency on which each power spectrum will be
calculated. The unit is 1/day.
nfreq = integer
The number of uniform frequency steps between fmin and fmax
over which the power spectrum will be calculated.
method = string (ft)
Choose a method for calculating the power spectrum. Currently,
only 'ft', a discrete Fourier transform, is available.
ntrials = integer
The number of Monte Carlo trials required before calculating the
best periods, period uncertainty and confidence in the
measurement.
plot = boolean
Plot the output window function?
clobber = boolean (optional)
Overwrite the output file? if clobber = no and an existing file has
the same name as outfile then the task will stop with an error.
verbose = boolean (optional)
Print informative messages and warnings to the shell and logfile?
logfile = string (optional)
Name of the logfile containing error and warning messages.
status = integer
Exit status of the script. It will be non-zero if the task halted with an
error. This parameter is set by the task and should not be modified by the
user.
DESCRIPTION
keptrial measures the strongest period within the frequency
range fmin to fmax and estimates the 1-σ
error associated with that period. The error estimate is
performed by constructing ntrial new light curves from
the original data provided in datacol and adjusting each
individual data point according to a random number generator and
a shot noise model. While a shot noise model is not uniformly
applicable to all Kepler targets it provides a useful 1st order
estimate for most. A power spectrum is calculated for each light
curve using a user-specified method and the highest
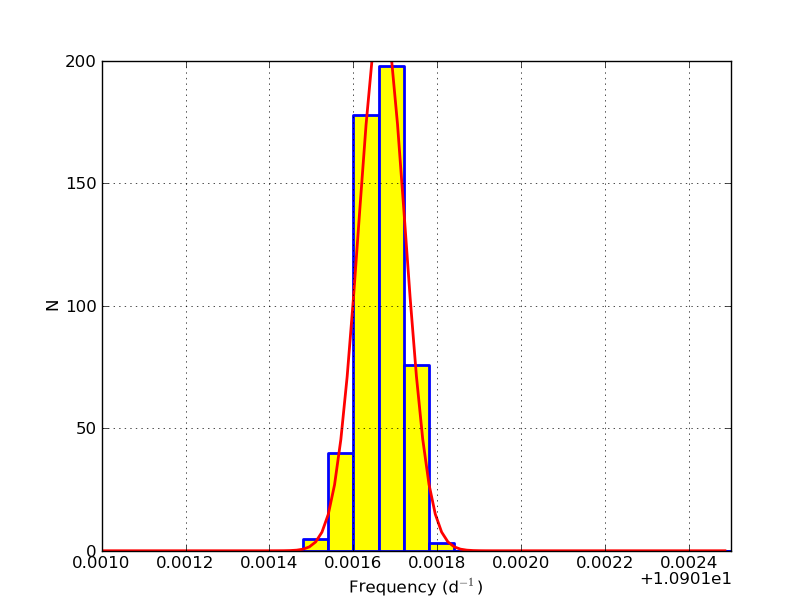
peak in each power spectrum recorded. The distribution of peaks
is fit by a normal function, the centroid is adopted as the best
period and the 1-σ error is taken from the standard
deviation. A confidence limit is recorded as the range within
which all trial periods fall. While this is termed a '100%'
confidence limit, this only refers to the total number of trials
rather than formal confidence.
The larger the number of
ntrialss, the more robust the result. The values of
nfreq and ntrial have to be chosen
carefully to avoid excessive run times. The values of fmin,
fmax and nfreq have to be chosen carefully in
order to provide a sensible measure of period and error. It is
recommended that kepft be used to estimate the period and
error before attempting to use keptrial. An exercise of
trial and error will most-likely be needed to choose a
permutation of fmin, fmax and nfreq that
resolves the period distribution over a significant number of
frequency bins. If requested, the distribution and normal fit
are plotted. The plot updates after every ntrial iteration,
partly to relieve boredom, and partly for the user to assess
whether they are using the correct permutation of input
parameters. -C from the keyboard will break the task
instantly if the user wishes to restart the process with new
input arguments.
The task reports period, error and confidence
to the working shell, but also writes the information to FITS
keywords in a new table extensions of the output file. The table
contains the most-significant frequency obtained for each individual power
spectrum calculation.
EXAMPLE
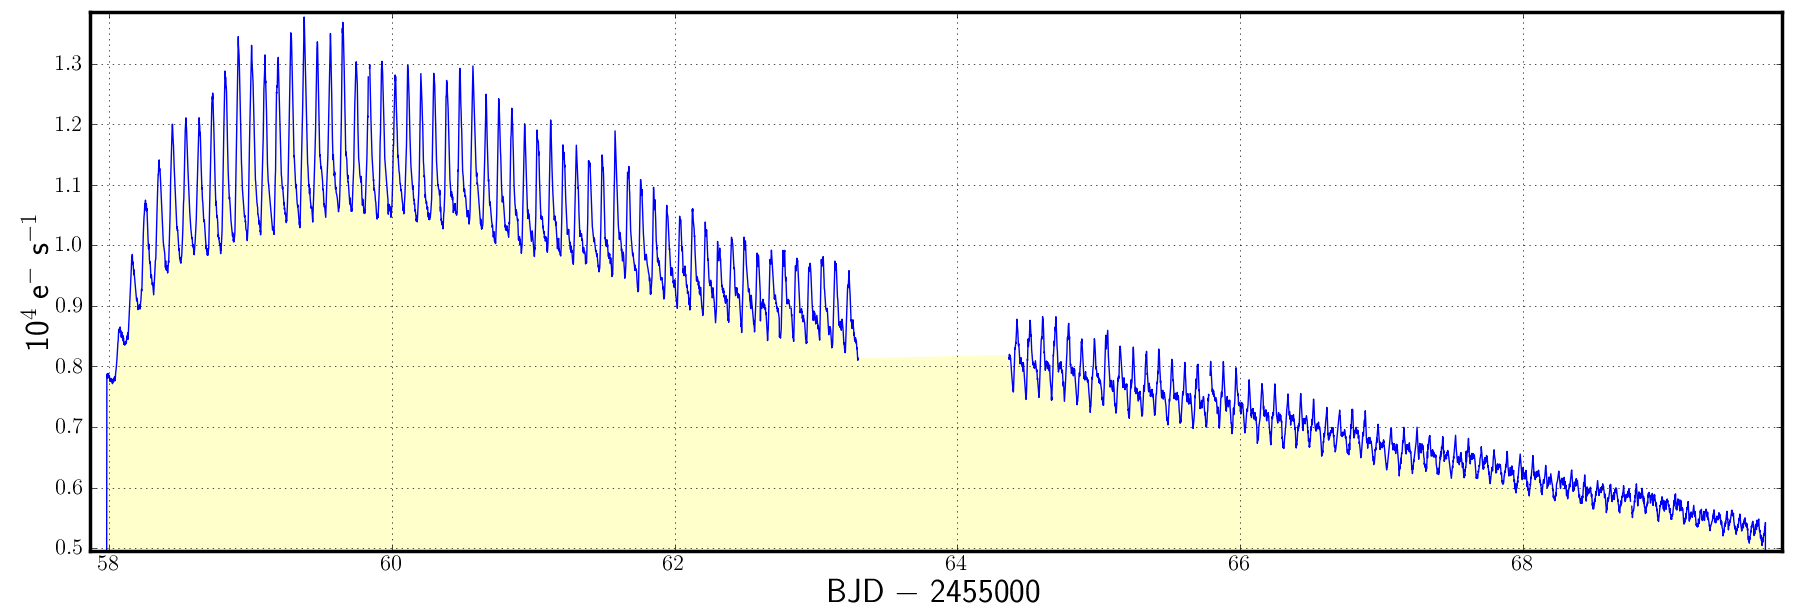
- keptrial infile=kplr002436324-2009259160929_llc.fits
outfile=output.fits datacol=SAP_FLUX errcol=SAP_FLUX_ERR
fmin=10.902 fmax=10.9035 nfreq=25 method=ft ntrials=500 plot=y
TIME REQUIREMENTS
Completion times depends on the data cadence and the values of
nfreq and ntrials. using a 3.06
GHz Intel Core 2 Duo Mac running OS 10.6.4, 25 frequency steps
over 12 days of short cadence data and 500 trials takes 50 minutes.
BUGS AND LIMITATIONS
The Kepler PyRAF package is privately-developed software made available to
the community through the contributed software page of the GO program at
http://keplergo.arc.nasa.gov/ContributedSoftware.shtml. It is not an
official software product of the Kepler mission. Bugs and errors are not
the responsibility of NASA or the Kepler Team. Please send bug reports and
suggestions to keplergo@mail.arc.nasa.gov.
HISTORY
|
|
|
|
|
|
|
Initial software release (MS)
|
|
|
|
Code can now be run from the command line (TB)
|
|
|
|
more reliable plot rendering on linux operating systems (MS)
|
SEE ALSO
kepclip, kepdynamic, kepft, keptrial
|


