|
NAME
kepft -- Calculate and store a Fourier Transform from a Kepler time series
USAGE
kepft infile outfile fcol pmin pmax nfreq plot clobber verbose
logfile status
PARAMETERS
infile = string
The name of a
MAST standard format FITS file containing a Kepler light curve
within the first data extension.
outfile = string
The name of the output FITS file with a new extension containing
the Fourier spectrum.
fcol = string
The name of the FITS table column in extension 1 of
infile upon which the Fourier transform will be calculated.
pmin = float
The minimum of the period range over which the Fourier
transform will be calculated. The unit is day.
pmax = float
The maximum of the period range over which the Fourier
transform will be calculated. The unit is day.
nfreq = integer
The number of uniform frequency steps between 1/pmax and 1/pmin
that the Fourier transform will be calculated.
plot = boolean
Plot the output Fourier spectrum?
clobber = boolean (optional)
Overwrite the output file? if clobber = no and an existing file has
the same name as outfile then the task will stop with an error.
verbose = boolean (optional)
Print informative messages and warnings to the shell and logfile?
logfile = string (optional)
Name of the logfile containing error and warning messages.
status = integer
Exit status of the script. It will be non-zero if the task halted with an
error. This parameter is set by the task and should not be modified by the
user.
DESCRIPTION
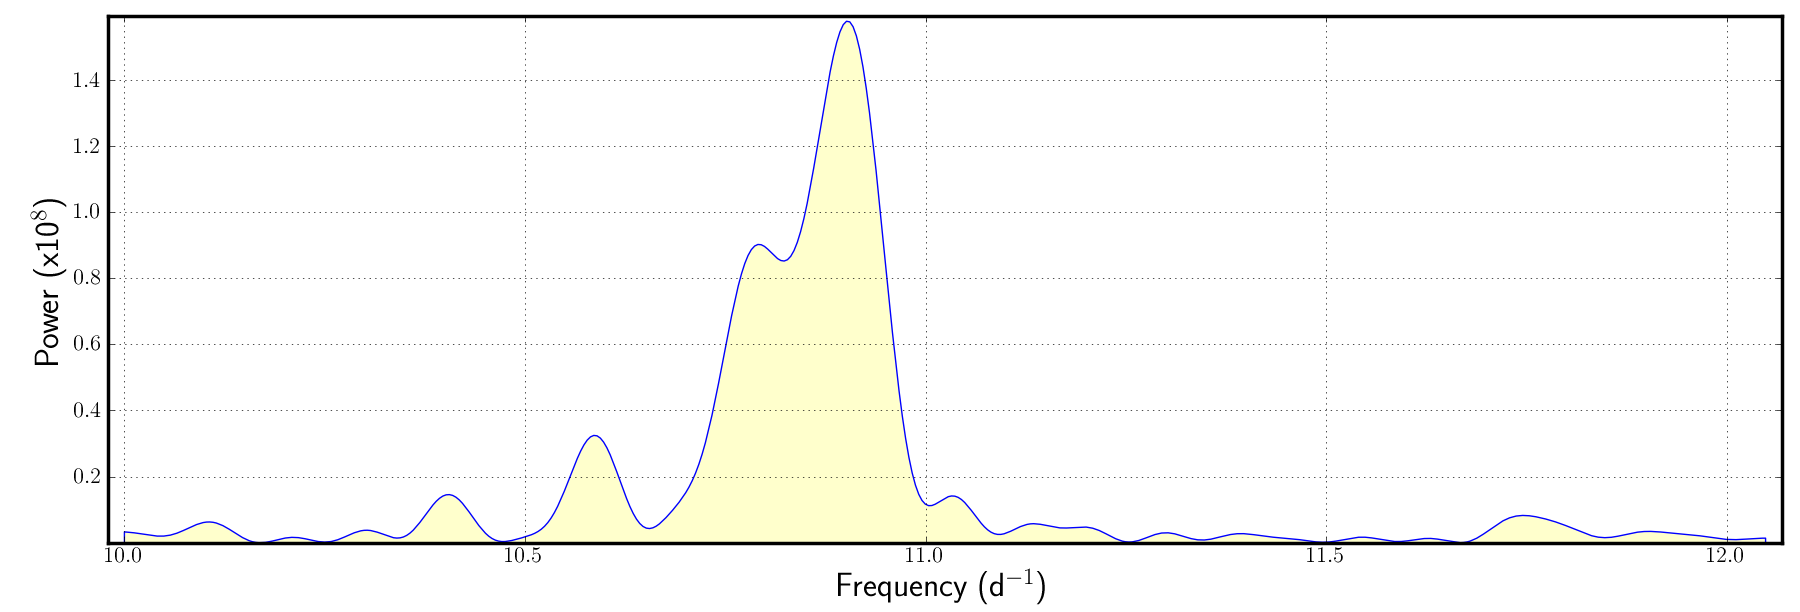
kepft calculates the discrete Fourier transform for a
user-provided Kepler time series. The result is stored in a new
FITS file that is a direct copy of the input file but with an
additional table extension containing the power spectrum. A
permanent copy of the optional plot can be stored by using the
save button on the plotting GUI.
EXAMPLE
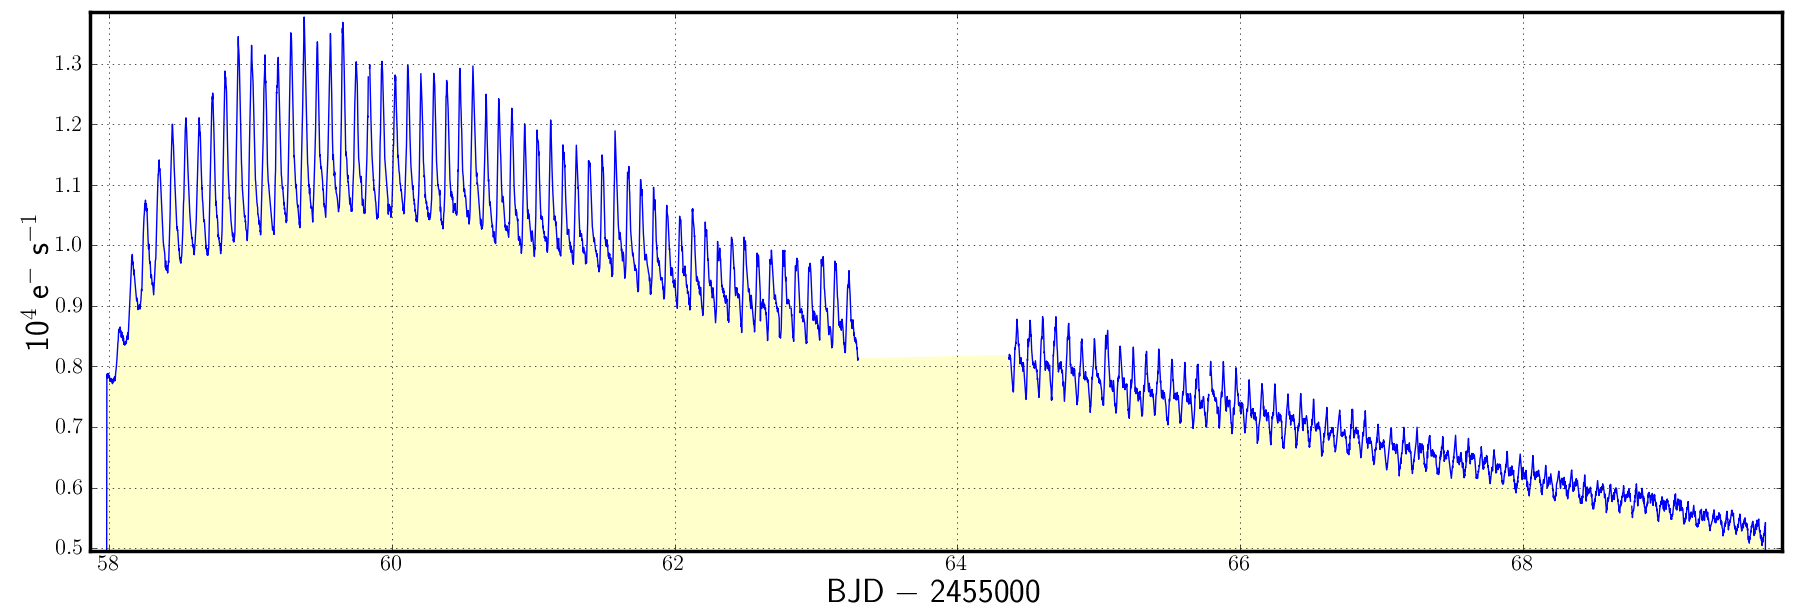
- kepft infile=kplr002436324-2009259160929_llc.fits
outfile=output.fits fcol=SAP_FLUX pmin=0.083 pmax=0.1
nfreq=500 plot=y
TIME REQUIREMENTS
Full completion upon one quarter of Kepler target data
depends on the data cadence and the value of nfreq. using a 2.66
GHz Intel Core i7 Mac running OS 10.6.4, 100 frequency steps
on a full quarter of long cadence data takes 10 seconds.
BUGS AND LIMITATIONS
The Kepler PyRAF package is privately-developed software made available to
the community through the contributed software page of the GO program at
http://keplergo.arc.nasa.gov/ContributedSoftware.shtml. It is not an
official software product of the Kepler mission. Bugs and errors are not
the responsibility of NASA or the Kepler Team. Please send bug reports and
suggestions to keplergo@mail.arc.nasa.gov.
HISTORY
|
|
|
|
|
|
|
Initial software release (MS)
|
|
|
|
Updated for FITS v2.0 (MS)
|
|
|
|
Code can now be run from the command line (TB)
|
|
|
|
more reliable plot rendering on linux operating systems (MS)
|
SEE ALSO
kepdynamic, kepwindow, keptrial, kepdetrend
|
