|
NAME
kepdynamic -- Construct a dynamic (time-dependent) power spectrum from Kepler time series data
USAGE
kepdynamic infile outfile fcol pmin pmax nfreq deltat nslice
plot cmap clobber verbose logfile status
PARAMETERS
infile = string
The name of a
MAST standard format FITS file containing a Kepler light curve
within the first data extension.
outfile = string
The name of the output FITS file with a new image extension containing
the dynamic power spectrum.
fcol = string
The name of the FITS table column in extension 1 of
infile upon which the sequence power spectra will be calculated.
pmin = float
The minimum of the period range over which the power spectra
will be calculated. The unit is day.
pmax = float
The maximum of the period range over which the power spectra
will be calculated. The unit is day.
nfreq = integer
The number of uniform frequency steps between 1/pmax and 1/pmin
over which the power spectra will be calculated.
deltat = float
The uniform length of each time slice from which a power spectrum
will be calculated. Units are days.
nslice = integer
The number of time slices from which power spectra are
calculated. These will be distributed uniformly across the
input time series. If nslice is small there may be data gaps in
the dynamic power spectrum. If nslice is large, the time slices
will overlap. Both cases are valid.
plot = boolean
Plot the output Fourier spectrum?
cmap = string (optional)
Color intensity scheme for the image plot. The various options
can be inspected and compared together if
cmap=browse. Options:
Spectral|summer|RdBu|gist_earth|Set1|Set2|Set3|Dark2|hot|RdPu|YlGnBu|RdYlBu|gist_stern|cool|gray|GnBu|gist_ncar|
gist_rainbow|bone|RdYlGn|spring|Accent|PuBu|spectral|gist_yarg|BuGn|YlOrRd|Greens|PRGn|gist_heat|Paired|hsv|Pastel2|
Pastel1|copper|OrRd|jet|BuPu|Oranges|PiYG|YlGn|gist_gray|flag|BrBG|Reds|RdGy|PuRd|Blues|Greys|autumn|pink|binary|winter|
prism|YlOrBr|Purples|PuOr|PuBuGn|browse.
clobber = boolean (optional)
Overwrite the output file? if clobber = no and an existing file has
the same name as outfile then the task will stop with an error.
verbose = boolean (optional)
Print informative messages and warnings to the shell and logfile?
logfile = string (optional)
Name of the logfile containing error and warning messages.
status = integer
Exit status of the script. It will be non-zero if the task halted with an
error. This parameter is set by the task and should not be modified by the
user.
DESCRIPTION
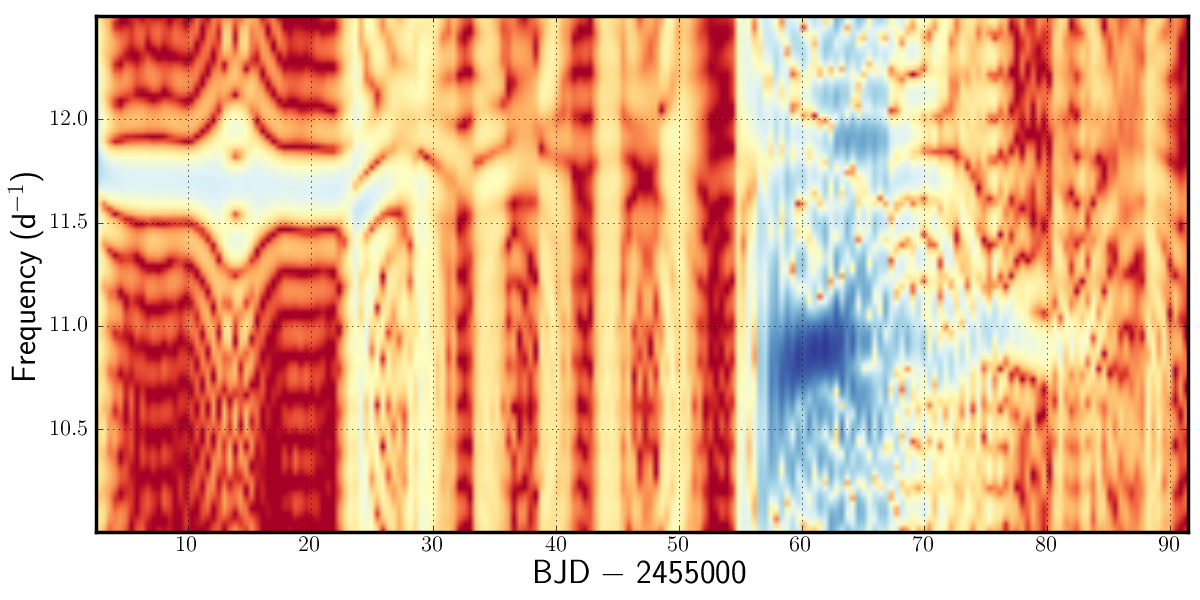
kepdynamic slices a time series into uniform discrete
time segments and calculates a power spectrum for each. The
resulting dynamic power spectrum is a 2D power map of time versus
frequency, measuring the evolution of periodic signal over time.
There is a wide selection of color maps to choose
from when displaying the FFI image. All possible choices can be found
by calling the tool with the following argument: cmap = browse.
The output FITS file is identical to the
input file except for a new image extension which contains the
power map.
EXAMPLE
- kepdynamic infile=kplr002436324-2009259160929_llc.fits
outfile=output.fits fcol=SAP_FLUX pmin=0.08 pmax=0.1
nfreq=500 deltat=5.0 nslice=200 plot=y cmap=RdYlBu
TIME REQUIREMENTS
Full completion upon one quarter of Kepler long cadence target
depends on the data cadence and the value of nfreq. using a 3.06
GHz Intel Core 2 Duo Mac running OS 10.6.4, 1000 frequency steps
on a full quarter of short cadence data with 200 time slices
takes 12 hours.
BUGS AND LIMITATIONS
The Kepler PyRAF package is privately-developed software made available to
the community through the contributed software page of the GO program at
http://keplergo.arc.nasa.gov/ContributedSoftware.shtml. It is not an
official software product of the Kepler mission. Bugs and errors are not
the responsibility of NASA or the Kepler Team. Please send bug reports and
suggestions to keplergo@mail.arc.nasa.gov.
HISTORY
|
|
|
|
|
|
|
Initial software release (MS)
|
|
|
|
Updated for Kepler FITS v2.0. Input argument defining the intensity scale of the plot added. (MS)
|
|
|
|
Code can now be run from the command line (TB)
|
|
|
|
more reliable plot rendering on linux operating systems (MS)
|
SEE ALSO
kepft, kepwindow
|


