


The NASA Star and Exoplanet Database (NStED)
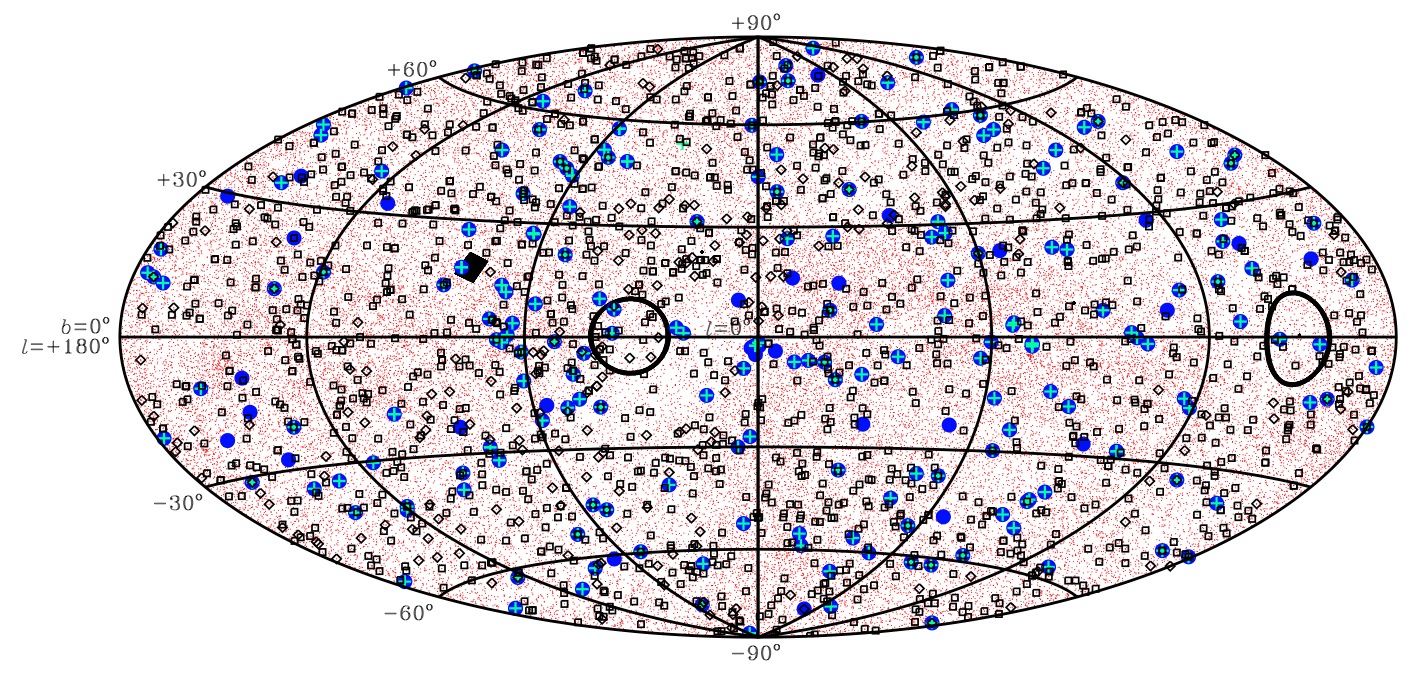
The figure displays the distribution of sources and data contained within the NStED database, plotted in an Aitoff projection of Galactic coordinates. The following is the key to the figure: Red dots: dwarf stars; Large blue dots: exoplanet hosting stars; Large green plus signs: stars with radial velocity curves or photometric light curves; Open Black Squares/Diamonds: stars with images/spectra. The large black square near galactic coordinates (l=67 deg; b=13 deg) represents the coverage of the TrES transit survey of the Kepler field. The large open circles represent the areas (center and anti-center regions) observable by the transit survey mission CoRoT.
NStED is a collaboration between the NStED group, IRSA, IPAC and NExScI.
Go to the NStED archive
Last Updated: 6 May 2008